Using Explorer you can query the PCE's traffic database to analyze traffic flows for auditing, reporting, and troubleshooting. You can search for traffic flows between workloads or hosts, labeled workloads, or IP addresses, and you can restrict the search by specific port numbers and protocols.
The VEN decorates the flow summary logs with DNS names when it sends them to the PCE. Explorer appends the DNS names to the flow logs so that auditors and SOC analysts can look at these DNS names instead of performing reverse look-ups on random IP addresses.
Explorer relies on traffic flow data stored in the PCE traffic database. When a single disk is used for all PCE storage, the default traffic database disk usage limit is in effect. When the amount of traffic flow data exceeds the limit, older data is pruned, and is no longer available in Explorer. To increase the amount of storage available for traffic flow data, you can set up a separate disk for the traffic database and set runtime parameters as required for a two-storage-device configuration. For more information, see PCE Storage Device Partitions in the PCE Installation and Upgrade Guide.
Explorer Searches
When you search data using Explorer, you are searching traffic flows between providers and consumers over a specific time period over a specific port and protocol.
When you want to search for particular traffic flows on a regular basis, you can save that filter and it appears under Favorites. You can make changes to an existing favorite and save the modified query. Explorer also displays your ten most recent searches. In Explorer, you can also see the effect of currently configured and unprovisioned policies on the traffic that was observed in the past.
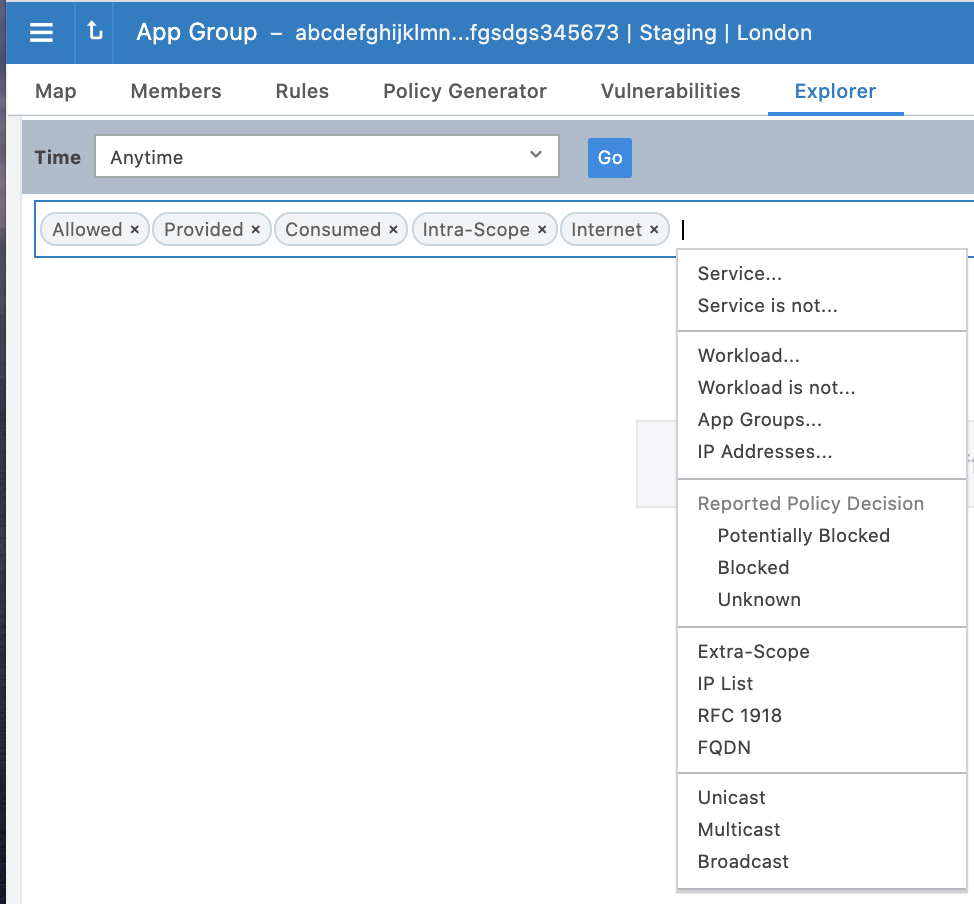
An Explorer search consist of the following elements:
- Consumers: Enter workloads, IP addresses, or labels that are consuming the service provided in the traffic flow. The entries you add in the Include field are used as a search criteria and the ones you add in the Exclude field are not used in the search.
-
Providers: Enter workloads, IP addresses, or labels that are providing the service in the traffic flow. The entries you add in the Include field are used as a search criteria and the ones you add in the Exclude field are not used in the search.
NOTE:You can choose to search either “Consumers And Providers” or “Consumers Or Providers” by clicking the settings icon.
- Services: Enter port and protocol, port ranges, process, Windows services, or policy services. Enter comma-separated port numbers and protocol types to search for traffic flows whose destination port values and protocols match the search criteria. The entries you add in the Include field are used as a search criteria and the ones you add in the Exclude field are not used in the search. If you do not specify a value, all ports, protocols, port ranges, processes, and services are included in the search.
- Time: Select how far in the past (last hour, day, week, or month, or anytime) or specify a custom time range. The custom time filter displays all the flows between the selected from-to date-time stamp.
-
Reported Policy Decision: Select the type of policy decision (allowed, potentially blocked, blocked, or unknown) to see the different policy-decisions for the same flow.
- Connection State: The following traffic flow states are displayed under the “Connection State” column in the Table view.
- Active: The flow is in progress.
- Closed: The flow in each direction is recorded and the connection (TCP only) is closed.
- Static: The flow came from a static illumination “snapshot” of the current connection, from an idle VEN, or from data imported from another source.
- Timed Out: No packets in either direction were received for a long time for this session and it is being timed out.
- Additionally, the following two “Blocked” traffic states are also listed:
- New: Dropped TCP packet that contains a SYN and is associated with a new connection
- Invalid: Dropped TCP packet that does not contain a SYN and is dropped by firewall as invalid
Explorer Search Results
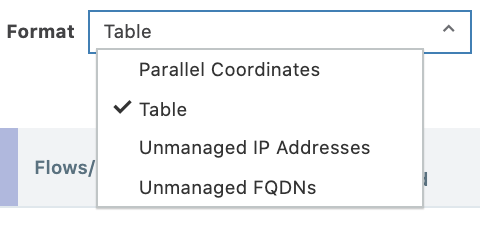
The Explorer search results can be displayed in the following three formats:
- Parallel Coordinates: Displays traffic flows as a vertical list of Consumers, Providers, and the port being used in the flows. You can click any item in the results to focus on specific flows. You can also sort the results to view based on port number or number of traffic flows.
- Table: Displays search results in a traditional table format. This view includes a column named Policy which indicates if the flow was allowed, blocked, or potentially blocked based on your policy. Flows that are potentially blocked could mean that there is no segmentation rule written for the flow or there is a segmentation rule written for the flow, but the provider workload's enforcement is set to Visibility Only.
-
Unmanaged IP Addresses: Displays all connections to or from hosts that are unmanaged IP addresses. This view is useful for discovering the IP addresses of hosts that you want to managed with the PCE, either as managed workloads or unmanaged workloads. You can create unmanaged workloads in this page by selecting one or more of the IP addresses and clicking Create Unmanaged Workloads.
- Unmanaged FQDNs: Displays all connections from the workload that are unmanaged FQDNs.
Flow Collection
In a data center that contains mostly Windows servers, certain types of broadcast and multicast traffic comprise a large percentage of total traffic, which can degrade the functionality and usefulness of the PCE. To resolve this, you can use the PCE web console to set per-org filters or aggregation rules to observe the ongoing traffic in your organization and filter out or aggregate the traffic based on destination address, subnet, protocol, and disposition (unicast, broadcast, or multicast).
You can configure the PCE traffic collector to drop or aggregate certain types of broadcast and multicast traffic based on the following criteria:
- Destination address (IP address or CIDR block)
- Destination port/protocol
- Transmission Type (broadcast or multicast)
Only users with Organization Owner roles can set the Flow Collection.
To set the flow collection:
- From the main navigation menu of the PCE web console, click Settings > Flow Collection.
- Click Add.
- Select the Action.
- Aggregate: Protocol, Destination IP Address, and Destination Port fields are not supported. Select the Transmission type and click Save.
- Select the Transmission type. You can only enter a single port for each filter. Multiple ports and port ranges are not supported.
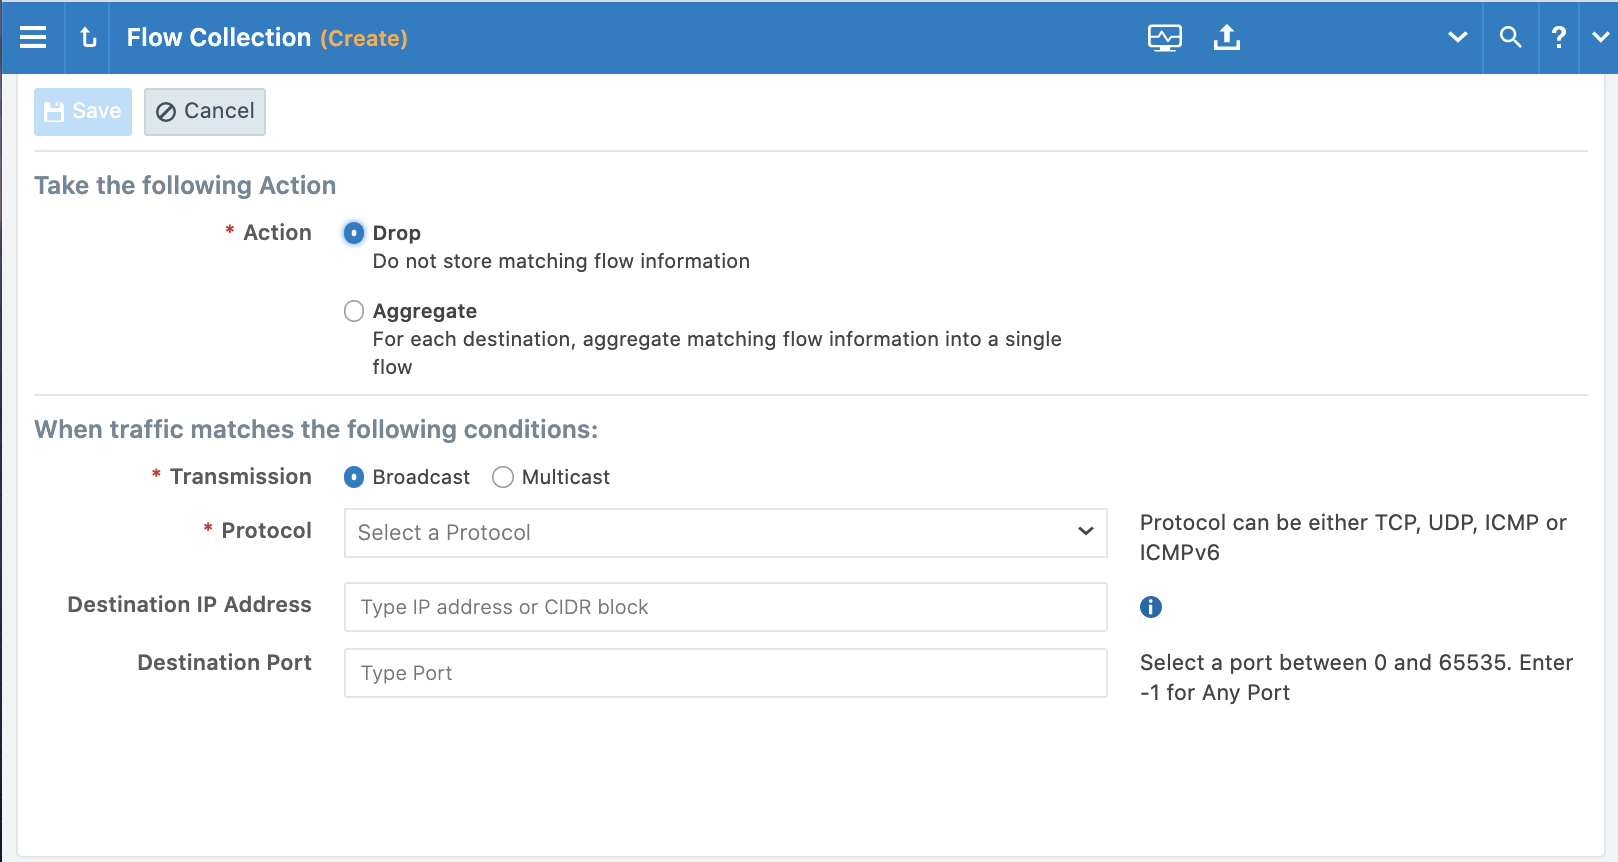
- After reviewing your selections, click Save.
- You can edit a filter by clicking on the row in the Flow Collection Filter page.