Illumination provides a unique new way to reveal the traffic flows in your network and to help you configure policies to secure your applications.
How the Illumination Map Works
Illumination maps the outbound connections from workloads to unknown IP addresses to fully qualified domain names (FQDNs) or DNS-based names. For example, Illumination could display that the outbound connections from a workload are going to maps.google.com instead of 100s of different IP addresses. The FQDNs used are reported by the VEN to the PCE in the flow summaries. The VEN learns about the FQDNs by snooping the DNS responses on the workloads, which is the FQDN for the IP address as seen by the workload. The FQDNs are also used in Policy Generator A tool in the PCE that simplifies the policy creation process by providing an easy way for application owners to write Intra- or Extra-Scope Rules for the individual applications they manage. to propose DNS-based segmentation rules and are displayed in Explorer.
The Illumination map visualizes the workloads that form logical groups (based on labels attached to workloads) and provides an understanding of the traffic flows between workloads.
You can take a static snapshot of existing, long-lived connections (for example, connections that must be active for six or twelve hours at a time) before pairing the workloads with the VEN. Any in-progress connections are captured to track the connection state, providing a static snapshot of established connections, including port and protocol information. In the Illumination map, these connections display in red until new matching traffic is observed by the VEN.
How to read the illumination map
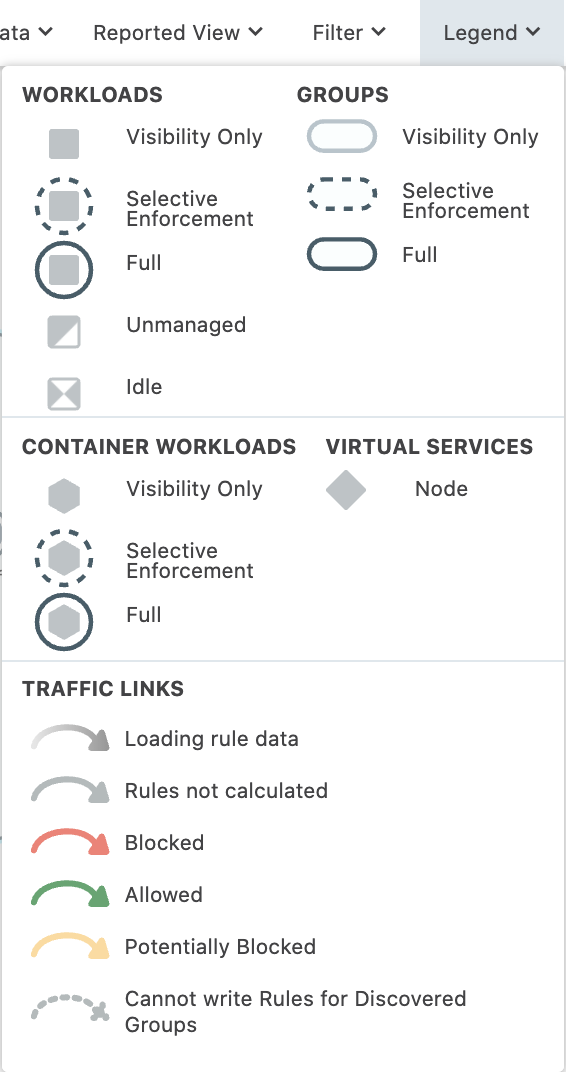
Legend

Pay attention at the following:
- Workloads and groups inside full dark lines depict the Full enforcement mode.
- Workloads and groups inside dotted lines depict the Selective enforcement mode.
- Visibility only enforcement mode is depicted with a light full line and with no circle around it.
Traffic links are presented with arrows in different colors:
- Green: traffic is allowed
- Yellow: traffic is potentially blocked
- Red: traffic is blocked
- Grey: rules are nor calculated
- Dotted line: segmentation rules cannot be written for the discovered groups
- Gradient arrows: the light color is next to the source and dark next to the destination. Gradient arrows are used while the rule data is still loading from the traffic.
Workflow for Using Illumination Map
Illumination enables you to build security policies for your Workloads by following this workflow:
- Group discovery: When you pair workloads, the VEN introspects those Workloads and determines their open ports, running services, and traffic flows. See the VEN Installation and Upgrade Guide for information about installing (also called pairing Installation of the Illumio VEN software on a workload using a unique secure pairing key. A Workload is paired by executing a pairing script generated from a Pairing Profile.) VENs on workloads.
- Prepare group for rules: Prepare a group for segmentation rules by applying labels to each workload in the group so you can write policies for them.
- Rule writing: After you have prepared the group for rule writing, you can begin to write segmentation rules for the workloads in the group. This requires writing segmentation rules to allow communication between workloads across groups, between workloads in the same group, or between workloads and other entities outside the group (for example, the Internet or an IP List). See Rule Writing in the Security Policy Guide for more information.
- Rule Testing: Illumination gives you the power to test and evaluate your segmentation rules against existing traffic flows without enforcing the segmentation rules. Segmentation rules can be tested to ensure that legitimate traffic flows required by an application are permitted and malicious traffic is blocked. Exporting traffic summaries or using blocked traffic lets you know which traffic connections would be dropped if the segmentation rules were enforced. .
- Policy Enforcement: When you are ready to implement the segmentation rules for a group, you can put the group into the enforced state. Leveraging Illumio's allowlist policy model The allowlist model means that you must specifically define what traffic is allowed to communicate with your managed workloads; otherwise, it is blocked by default. It follows a trust-centric model that denies everything and only permits what you explicitly allow—a better choice in today’s data centers. The list of what you do want to connect in your data center is much smaller than what you do not want to connect., any traffic flows that are not explicitly allowed by a segmentation rule are dropped. If a legitimate application flow is broken or an intrusion occurs, you can configure notifications to alert you.
Illumination View Levels
Depending on the number of workloads you have paired, the Full map is displayed for 60 or fewer workloads and the Location view is displayed for more than 60 workloads.
The Illumination map provides four levels of detail, depending on how many workloads are in your environment:
- Full map: Displays up to 60 workloads
- Location view: Displays groups by location
- Group view: Displays all groups within a selected location group
- Detail view: Displays details about a selected group
If your organization has fewer than 300 workloads, the PCE does not cache data and all maps and views are current. If your organization has more than 300 workloads, the group and location views are cached for 5-60 minutes, depending on complexity (as determined by the number of workloads, flows, and IP lists), but the Detail view is always current.
DHCP (UPD ports 67 and 68) and DNS (TCP/UDP port 53) traffic is not displayed in the Illumination map. DHCP and DNS traffic is allowed implicitly, so segmentation rules to allow this type of traffic are not required. DHCP or DNS traffic is included in the streaming flow summaries.
Full Map
When the PCE manages less than 60 workloads, you see them all in the Illumination map.
The Role label filter is only available in the Full map.
If you have more than 60 Workloads, the following views are also available:
Location View (Groups by Location)
When you first view the map, you see the Location view, which shows all groups organized by their Location label. When you click a specific location, the Illumination map zooms in to display more detailed information. A cached view of the data is used, so when the Illumination map contains fewer than 60 workloads, the data displayed in the map is current. If the map has more than 60 workloads, the time required to refresh the display increases incrementally with each workload, so the wait time for the display might be longer.
In the Global view, circles represent groups that share the same Location label. Summaries in the circle indicate the number of groups in the location and the total number of workloads in all the groups. Up to 75 groups are displayed and up to 2,000 groups can be displayed per location.
The Location view doesn't display workloads that are “discovered;” meaning, they don't have any labels or they have labels except for the Location label. These types of entities are only displayed in the Group Detail view when there is traffic to workloads in the expanded Group.
Click one of the Location groups to go to the Groups view.
Group View (Expanded Groups)
The Group view displays all of the groups inside a selected Location group. The number at the center of each group represents the number of workloads inside that group. When any of the groups are communicating with each other, you see the traffic connection between them.
In the Group view, rule coverage is only calculated when you have written segmentation rules that allow all traffic between the groups. When you are using Role-to-Role rules for all group roles or all group traffic, segmentation rule coverage might not be displayed accurately.
In the Group view, a cached view of the data is displayed to minimize rendering time. As a result, the displayed data might not reflect recent changes when you have more than 60 workloads (for example, there might be a short delay for new workloads or traffic or to reflect changes to IP lists and labels). If you have more than 60 workloads, the amount of time required to update the view increases incrementally based on the number of workloads in your organization. In the Group Detail view, the data is not cached so changes are reflected almost immediately.
In the Group view and the Group Detail view, traffic lines are displayed in green only if there is a segmentation rule written using group labels to allow all traffic between these two groups. In all other cases, traffic lines are gray to indicate that segmentation rule coverage can only be determined once both groups are expanded. After expanding the groups, each traffic line is displayed in green or red depending on whether or not that traffic is explicitly allowed by segmentation rules.
Click a group to go to the Detail view.
Detail View (One or Two Groups in Focus)
The Detail view focuses on the selected group and shows you the group’s constituent workloads grouped together by Role label. If any of the workloads inside the group are communicating with workloads in another group, you can expand the connected group to view details of traffic between roles. The view will focus on both groups and changes are reflected almost immediately.
When you click the Expand Roles icon, the workloads inside expand so you can see the traffic links for each connection. After the workloads are visible, you can start writing segmentation rules to allow the traffic between selected roles within or across groups by clicking on the traffic links and selecting the Add Segmentation Rule link to allow the traffic between selected roles.
In the Detail view, inter-group traffic lines to and from discovered groups are displayed in gray while the group is collapsed, since rule coverage cannot be calculated until the discovered group is expanded.
From the Detail view, you can view the role and hostname if available. You can view all a group’s constituent workloads by expanding the Role icon. To do this, click a Role icon and select Expand Roles from the command panel. After you do this, you can view details of traffic between workloads with same or different Role labels. You can view the hostname of the workloads along with their Role labels by zooming in on the map. When the workload does not have an assigned Role lLabel, the hostname of the workload displays.
Discovered workloads (workloads without labels) or No Location workloads (workloads without a Location label) are not displayed in the Location or Group maps, only in the Detail view when a connected group is selected from the Groups view.
The Illumination map also provides a timestamp for traffic flows to identify when a particular traffic flow was last detected. This timestamp is included in the exported flow records and is displayed in the Detail view in the “Last Detected” field.
When a workload first reports its traffic flow summary in the Illumination map, the traffic line displays in green as long as the outbound traffic from that providing workload is allowed. However, if the consuming workload does not allow the connection, the traffic line will turn red when the consuming workload reports it flow summaries.
The maximum number of workloads, after which the Workload Summary Page is displayed in Illumination is 100,000.
Reported and Draft Views
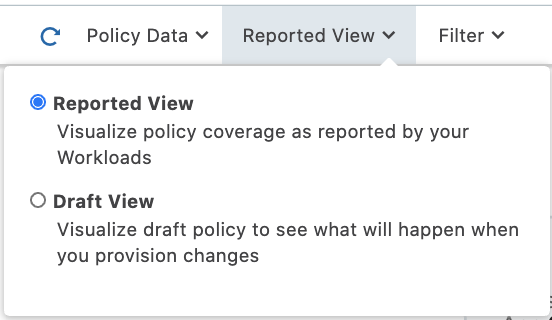
The Illumination map provides two views into your organization: the Reported and Draft views.
When a policy change occurs, only flows that are created after the policy change are displayed in red or green based on the new policy. Flows created before the policy change might continue to be displayed in red or green using the old policy.
Reported View
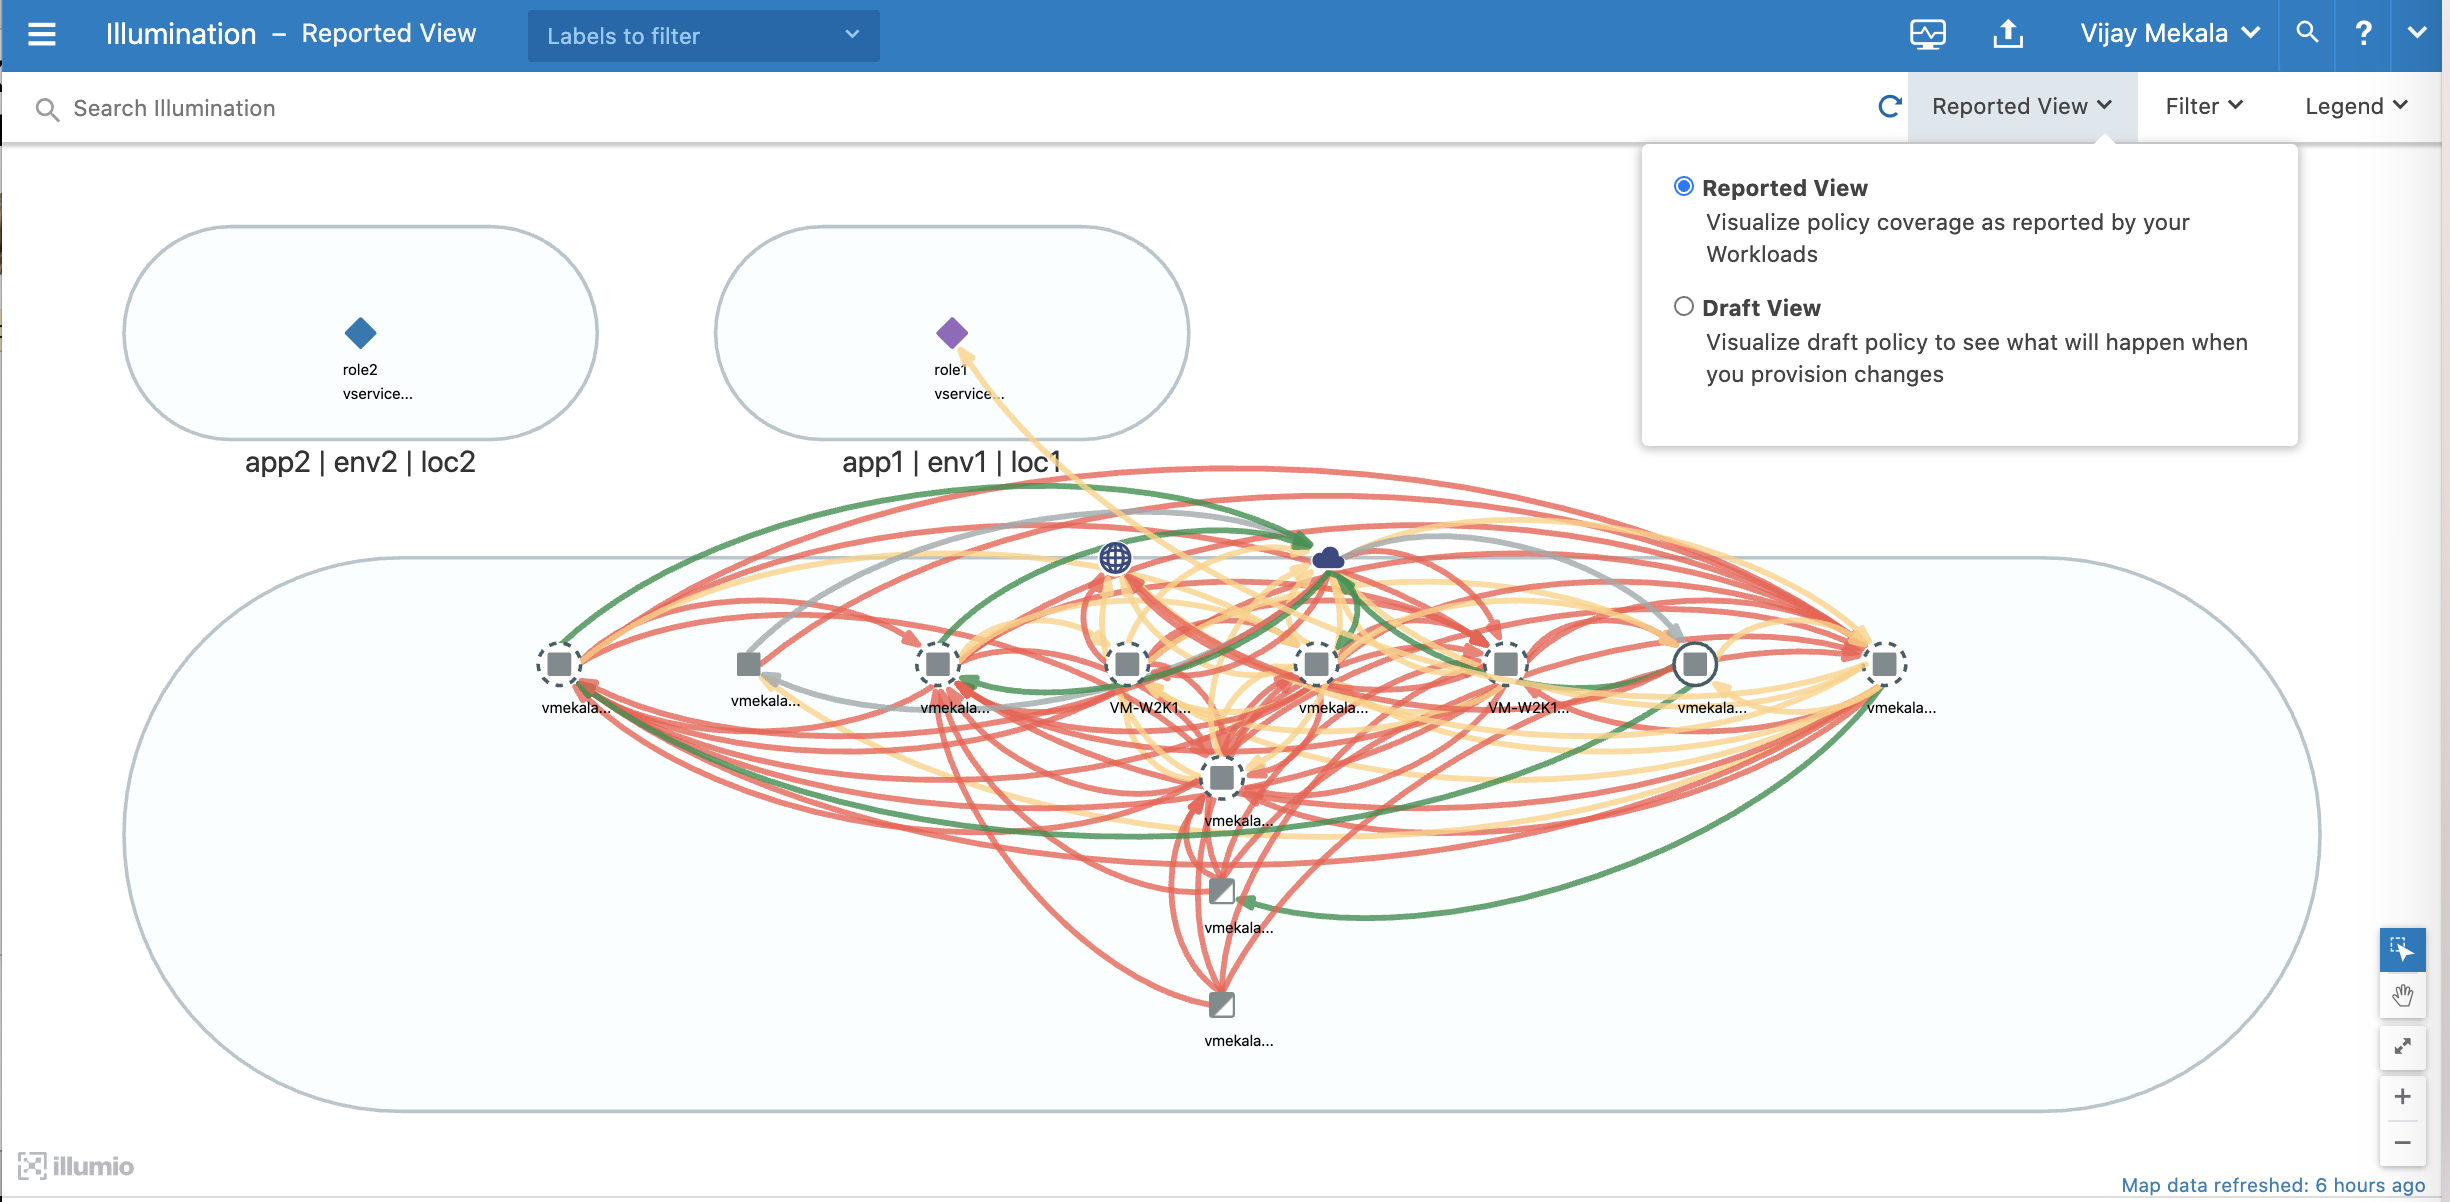
The Reported view visualizes your policy coverage as reported by your workloads, so you can examine the current state of your provisioned policy. This view displays the traffic using red or green lines to indicate whether the VEN had a segmentation rule that allows the traffic when the connection was attempted.
-
A green line indicates that the VEN had an explicit segmentation rule to allow the traffic when the connection was attempted
- A red line indicates that the VEN did not have an explicit segmentation rule to allow the traffic when the connection was attempted
If multiple segmentation rules allow traffic between entities, only one green line is displayed.
This view provides visibility for the actual traffic handling (rather than the expected traffic handling provided by the Draft view) and loads more quickly, especially when you have a large number of workloads and traffic flows.
Rules created for existing or live traffic don't change the color of the traffic lines in the Reported view, even when they are provisioned, until new traffic is detected.
The Reported view is a view-only map. You can view all the segmentation rulesets that apply to the workloads from the Reported view but you must change to the Draft view to add rules. The Reported view does not immediately reflect the latest changes to the policy. It is updated only after you provision a change to the policy and when new traffic flows that use the updated policy are reported from the VEN.
In Reported view, segmentation rule coverage (the number of connections that have been included in rules) is not supported for traffic between unmanaged workloads. The Draft view always provides accurate segmentation rule coverage for traffic between unmanaged workloads.
Reported View

Draft View
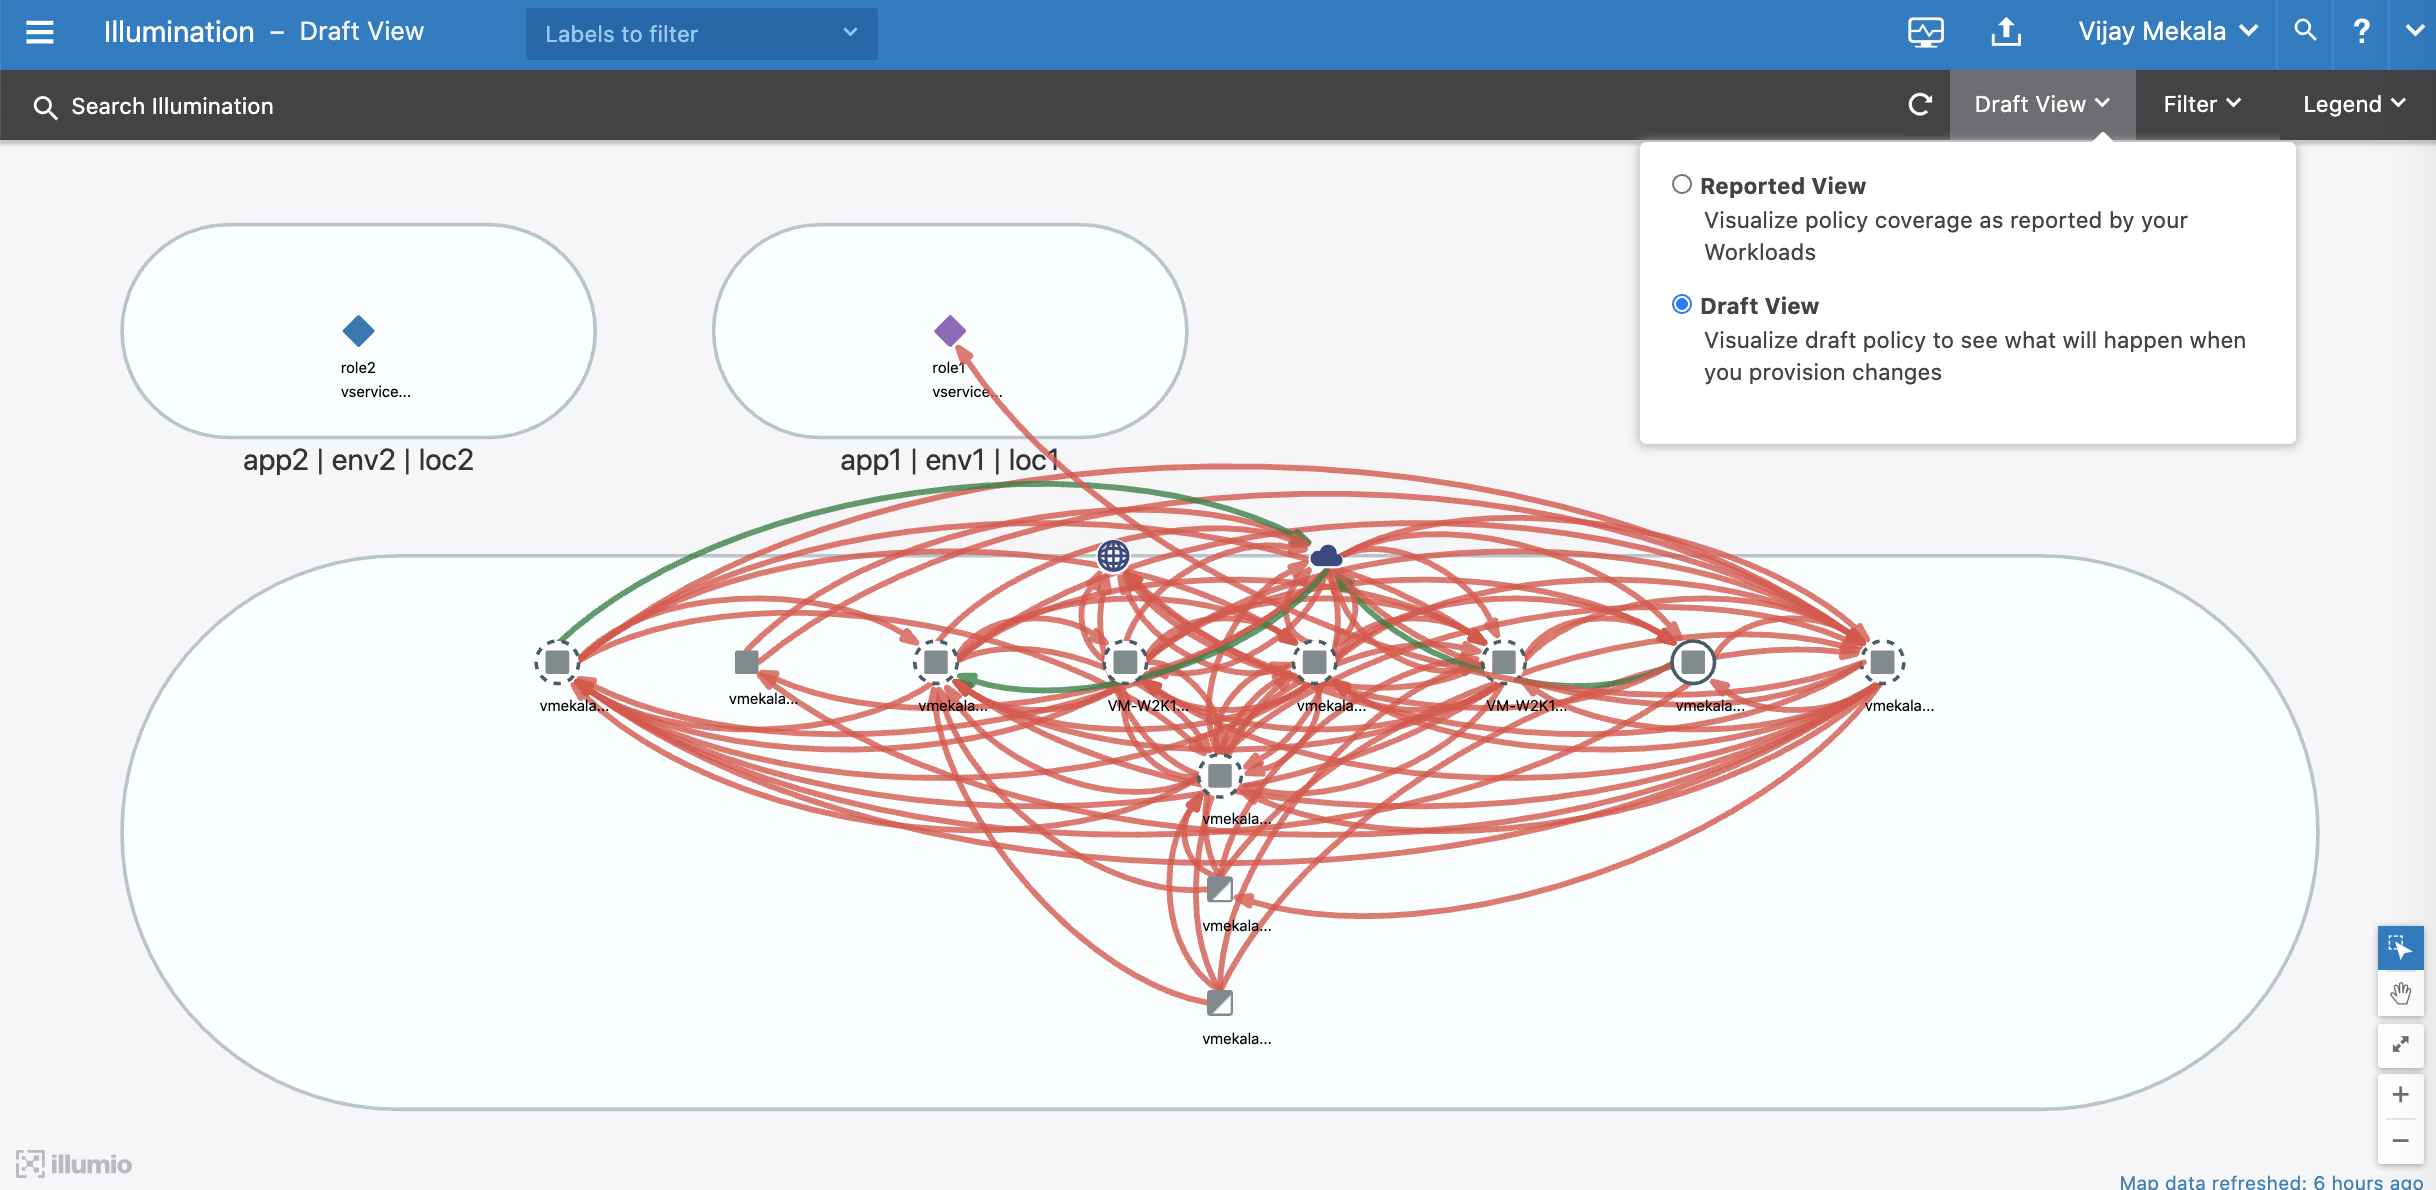
The Draft view visualizes the potential impact of your draft policy so that you can examine what will happen when you provision your changes. This view displays the traffic using red or green lines to indicate whether the PCE has a segmentation rule to allow the connection that was reported by the VEN. Specifically:
- A green line indicates that the PCE had an explicit segmentation rule (in either a draft or an active policy) to allow traffic when the connection was attempted.
- A red line indicates that the PCE did not have an explicit segmentation rule (in either a draft or an active policy) to allow traffic when the connection was attempted.
This view helps provide an understanding of the expected traffic handling (rather than the actual traffic handling provided by the Reported view) and considers both recently provisioned policy and draft policy. This map can take longer to load than the Reported view, especially if you have a large number of workloads and traffic flows, since the PCE has to compute the expected coverage for each traffic flow.
In Draft view, you can either view the segmentation rule that would permit traffic (turning the color of the line from red to green) or add a segmentation rule to allow a specific flow. In this view, you can immediately see the impact of the latest changes to the active or draft policy as they are reflected in the color of the traffic lines.
In Draft view, segmentation rule coverage is now supported for Windows process-based services. You can analyze the effect of the policy change and edit the segmentation rule before you provision it. Rules written for specific user groups are not included in segmentation rule coverage. The Reported view always provides accurate segmentation rule coverage for process- or user group-based segmentation rules.
Draft View

The default view in the Illumination map is the Reported view. The current view is identified in the upper left corner, next to the Select Labels to filter views field (either “Illumination - Reported View” or “Illumination - Draft View”). The different colors of the backgrounds help you quickly identify the current view.
Limitations of Draft View
The Draft view is the result of a “what-if” analysis conducted by the PCE. It is a modeling tool that depicts whether flows known to the PCE will be allowed or blocked, based on the configured policy. The modeling might not work correctly for the following types of segmentation rules configured on the PCE:
- Process-based rules: Process-based segmentation rules are written using the process name or service name that sends or receives the traffic on the workload.
- User-based rules: User-based segmentation rules allow administrators to leverage the Microsoft Active Directory User Groups to control access to computing resources.
- Custom iptables rules: Custom iptables segmentation rules are configured on each workload and can include processes that are not known to the PCE.
- System rules: The VEN has implicit segmentation rules to permit necessary traffic (for example, rules permitting DHCP and DNS outbound traffic on the workload).
In most cases, the Reported view provides an accurate representation of what will be allowed or blocked by the VEN, so the Reported view should be used to verify your changes.
Changing Views
You can switch between the two views by selecting the view from the top right corner of the PCE web console.

Command Panel
The command panel in the Illumination map displays information about a selected traffic flow. To view the command panel, select a traffic line on the Illumination map.
For optimal scale and performance, if there are two connections with the same source workload, destination workload, destination port, and protocol but the process or service names are different, the two connections are combined in the Illumination map. The process or service name that was part of the most recently reported connection is displayed.
The command panel displays the following information:
- Services between the provider and the consumer
- Rule coverage for each service, based on the draft rules in Draft view and as reported by the VEN in the Reported view
- Providers
- Consumers
- When this traffic was last detected, based on the last detected timestamp for the selected service
The command panel displays up to 64 ports per IP address per traffic link, up to 5 overlapping IP lists per IP address, and up to 500 IP addresses per traffic link.
If there are no rules associated with this traffic flow, a link to add a rule is displayed in the Draft view.
The Reported view helps you to understand your traffic patterns. You can view all segmentation rulesets with segmentation rules that apply to the selected traffic link, but you cannot add a segmentation rule in the Reported view. If you click the View Rulesets link, the Rulesets page displays.
For each flow with a unique port/protocol, if there is a policy service created for that port/protocol, the name of that olicy service displays, instead of the names of the actual services that reported the flows. The Reported view shows reported segmentation rule coverage for the latest reported flow with that port/protocol in the command panel. If there is no policy service that matches that port/protocol, either a separate entry displays for each service name reported in the flows or “Unknown” displays when the service name could not be captured (for example, an outbound flow).
While creating a service, if the traffic is to a Windows server, Illumination automatically picks a Windows-based service to create and display the process name. You have the option to add the path later. The traffic link turns green when you have a segmentation rule that uses a service that is process-based.
Different services can running on the same port at different times or on different interfaces. The Reported view shows reported segmentation rule coverage of each flow separately, as well as its timestamp. To hide entries that have potentially outdated segmentation rule coverage, use the Traffic filter “Hide traffic detected before last policy provision time.” In both cases, the Draft view shows the calculated segmentation rule coverage for port/protocol, without considering flow's service names or segmentation rules with process name/service name based policy services.
If there are multiple segmentation rules allowing traffic, only one segmentation rule is displayed in the Traffic Link panel.
Illumination Filters
In the Illumination map, you can select one of several traffic filters so you can show or hide different elements of the map and focus on what is most important to you. By default, all options are selected.

Label Filters
This filter restricts the Illumination map to only those entities that have the labels you enter in the filter at top of the map. For example, you might want to filter the Illumination map to show only those workloads with the Web Role label.
The Label filter does not filter the selected group. Only the connected groups are filtered. The Role Label filter is only available in the Full map.
Workload Enforcement Filter
Using the Workloads section of the filter select to see only those workloads that are in a particular enforcement state. For example, you might want to see only those workloads that are in Full Enforcement, so you can write segmentation rules for them.
Traffic Links Filter
You can also filter the Illumination map to show or hide network traffic. For example, you can hide or show all traffic inside a group, traffic among groups, or even hide all the traffic that is currently being allowed by your security policy.
You can also select to show or hide traffic generated by specific services. For example, you might not want to see traffic for common running services that would clutter the Illumination map with traffic not relevant to your policy.
You can also choose to display only recent traffic (as defined by the timestamp). For example, you can hide all traffic that has not been observed since the last time a policy was provisioned by checking the Hide traffic detected before last policy provision time checkbox.
This filter is only available in the Reported view. For more information, see Reported and Draft Views.
The Traffic Volume slider at the bottom allows you to filter by the number of traffic connections. This filter is only available in the Full map. When other filters are selected, the number of traffic connections displayed by the slider does not change.
Illumination Impact on Workloads
Illumination provides rich visibility into your workloads (traffic flows and running services) without blocking traffic, so you can build and test policies before you enforce them. Illumination implements industry standard security settings on those workloads in Illumination mode. The following table describes how Illumination impacts your workloads.
| Category | Impact |
|---|---|
| What gets installed |
Windows and Linux Illumio daemons are started and running. An additional daemon is started when SecureConnect is enabled. An Illumio user is created to run some of the daemons. Linux iptables kernel module is installed (if not already on the target system) and segmentation rules are installed in the kernel iptables. Any existing iptables segmentation rules are removed. Windows For Windows workloads that are paired with the PCE, the VEN takes control from Windows Firewall and install a Windows Filtering Platform (WFP) callout driver. Illumio segmentation rules are added as WFP filters and the WFP callout driver captures information about traffic that matches the WFP filters. |
| Changes to target Workload's global security settings |
The following basic security settings are implemented on workloads in Visibility Only:
|
| Traffic that is dropped |
The following traffic is dropped when you pair a workload in Visibility Only:
|
| Traffic that is Allowed | The following traffic is allowed in Visibility Only:
|
| IPv6 | All IPv6 traffic is allowed by default but can be blocked. For more information, see “Allow or Block IPv6” in the PCE Administration Guide. |
| SecureConnect |
When enabled, SecureConnect creates IPsec connections between workloads in a segmentation ruleset's segmentation rules. When you have SecureConnect enabled on a workload, the following applies:
|