In the PCE web console, you can find the following maps to help you visualize your environment:
- Illumination
- App Group Map
- Explorer
- Vulnerability Map
About the Maps
The maps in the PCE web console provide the following features.
Draft vs Reported in the Maps
In Illumination and the App Group Map, you have two views.
-
Draft: For existing policy, shows the effect that the policy has on detected traffic flows and turns lines green (or in Explorer reports the traffic as allowed).
NOTE:In Core 20.2.0 and later releases, draft view is also available for Explorer.
- Reported: Only shows the lines turning green (or in Explorer reported as allowed) after the policy was added, provisioned to the workloads, and a new traffic flow is detected.
See
IP Lists and Unknown Traffic
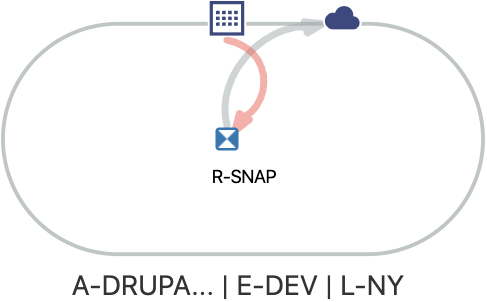
You create IP lists in the PCE to define your subnets, IP ranges, or a set of IP addresses. They are represented as a box containing 12 dots. The PCE web console displays unknown traffic as going to a blue cloud icon.
See
Color Vision Deficiency Filter
In your Profile Settings, the PCE web console includes a Color Vision Deficiency option for customers who are colorblind. To enable this option, click your username in the upper right corner of the console and choose My Profile. Select the Color Vision Deficiency option and save the change.
When this option is enabled, green (allowed) traffic displays as blue in Illumination and the App Group Map.
Review Maps Prior to Creating Policy
Before you begin creating policy for your environment, Illumio recommends that you analyze your traffic. You can analyze your traffic by viewing Illumination, the App Group Map, and Explorer. Viewing your traffic in Explorer is a great way to analyze your traffic because the data in it is sortable and exportable, and you can filter the traffic flows that are already impacted by policy.
Illumination
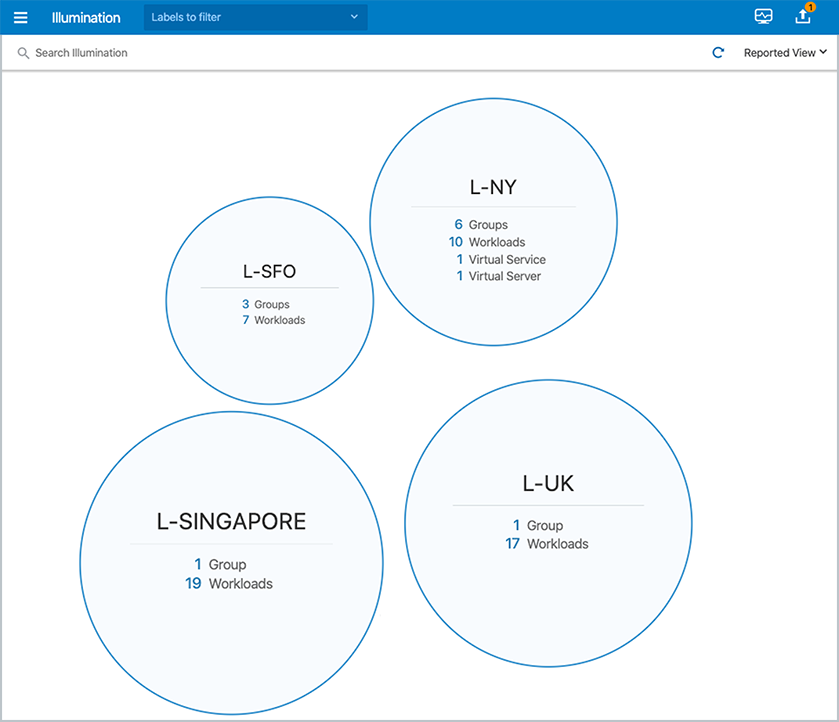
Illumination provides a unique way to reveal the traffic flows in your network and to help you configure policies to secure your applications. Illumination maps the outbound connections from workloads to unknown IP addresses to fully qualified domain names (FQDNs) or DNS-based names. For example, Illumination could display that the outbound connections from a workload are going to maps.google.com instead of hundreds of different IP addresses.
Illumination is organized from a location perspective. Clicking a location bubble in Illumination displays the workloads mapped to that location.
See
App Group Map
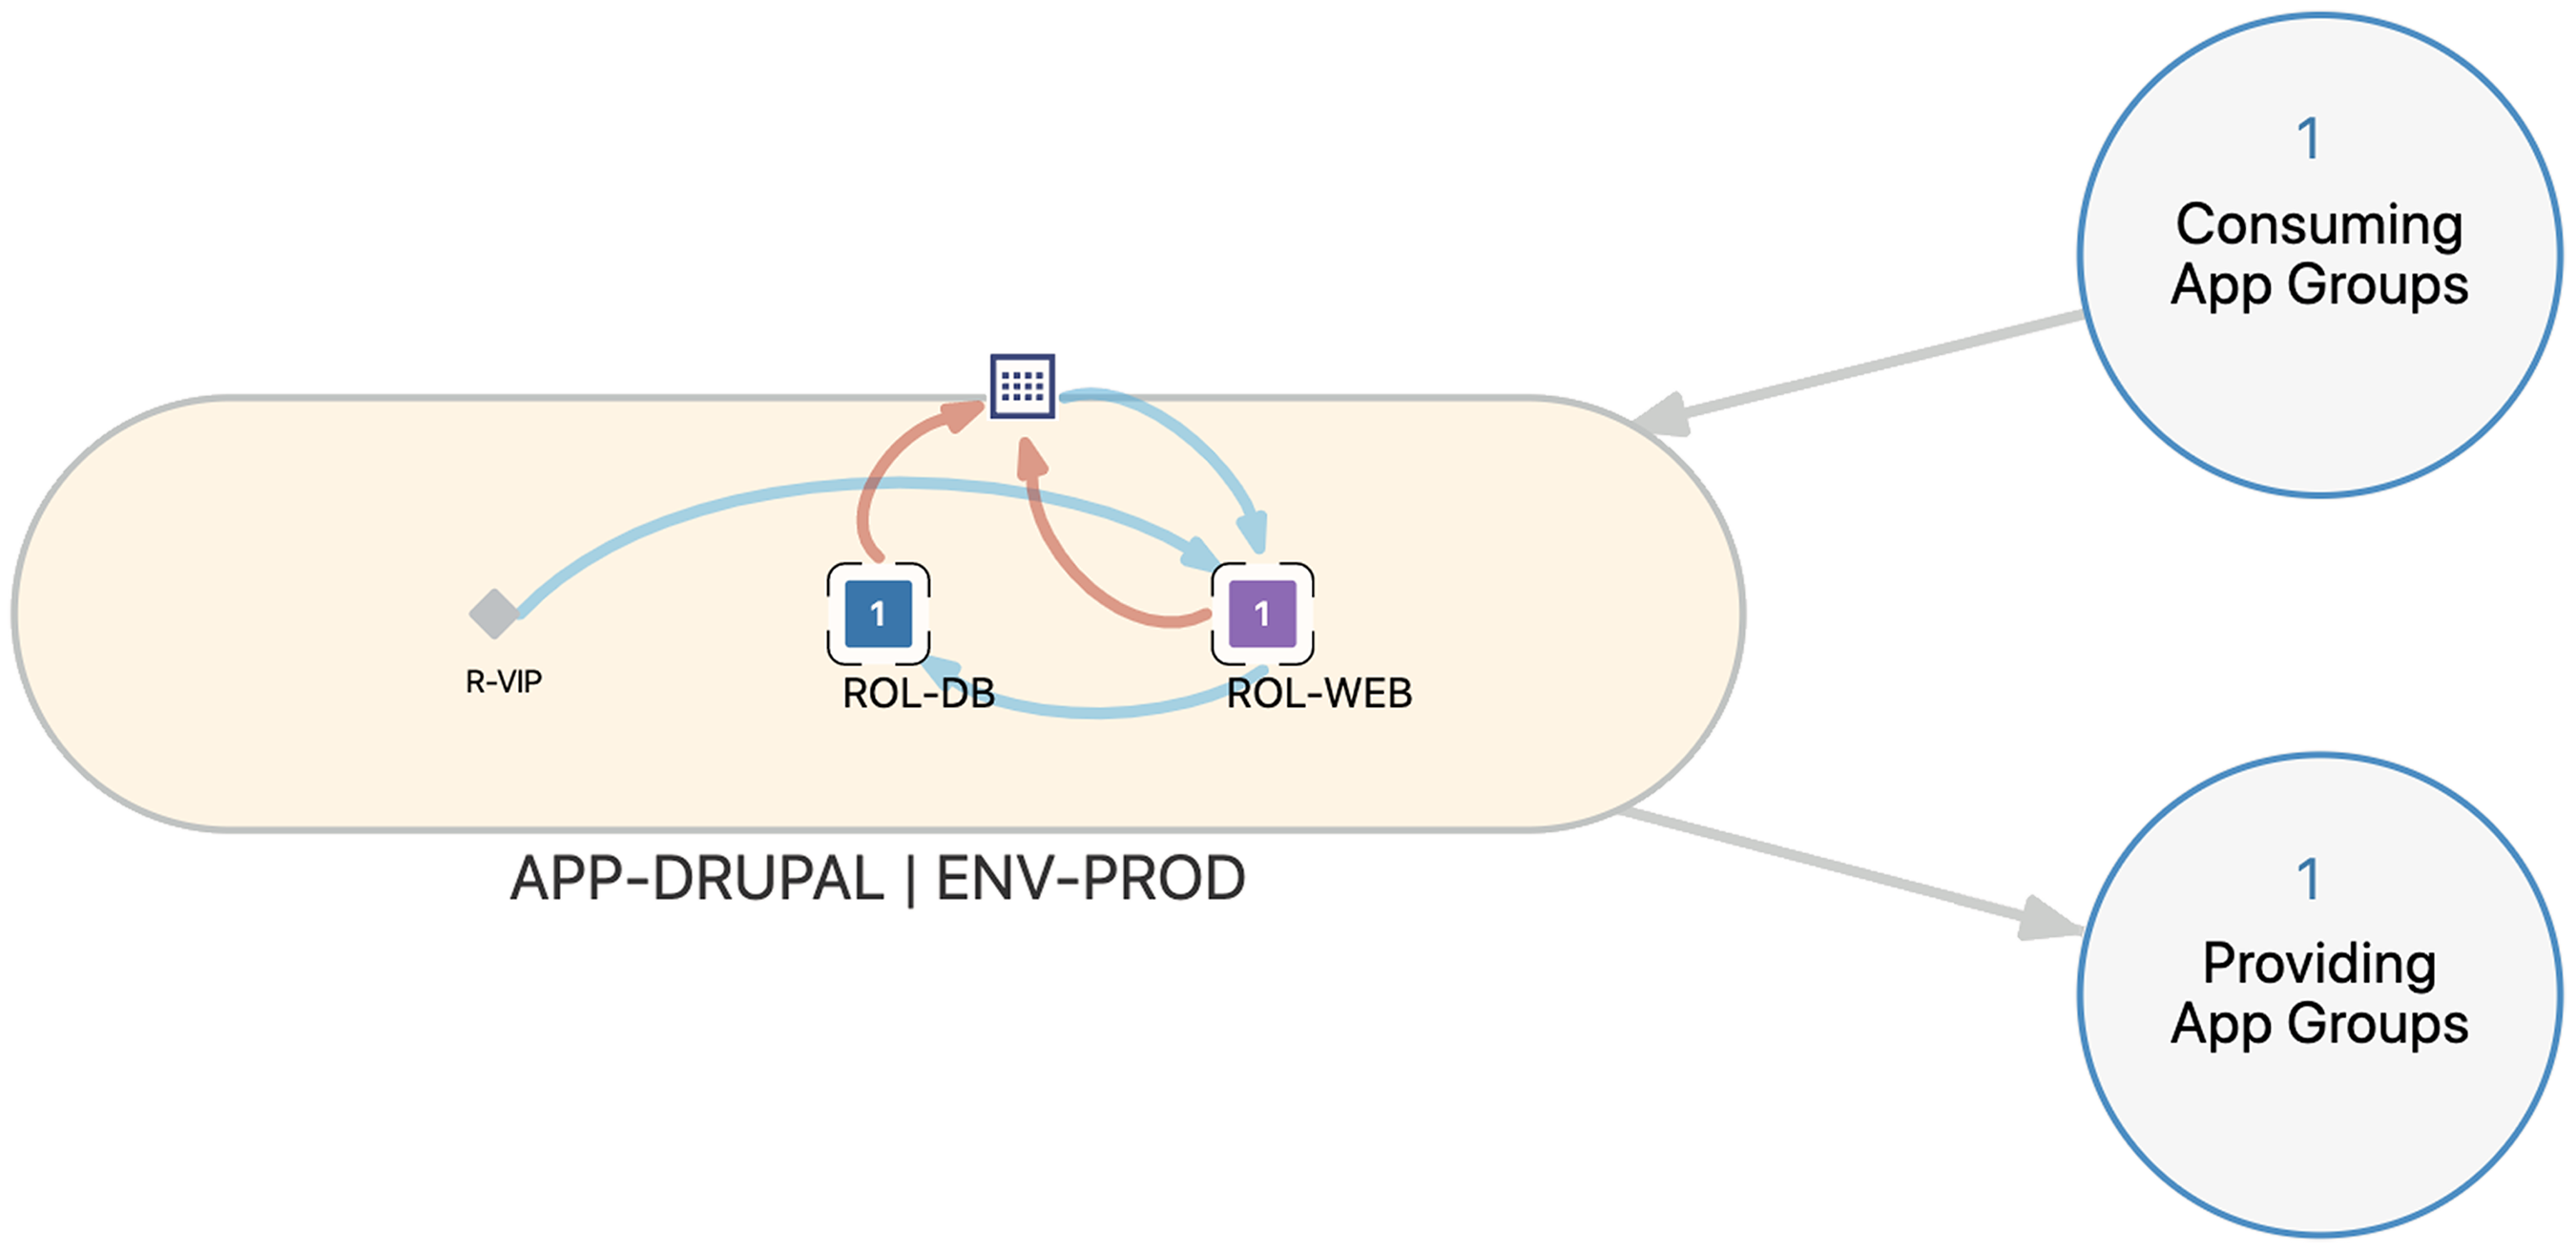
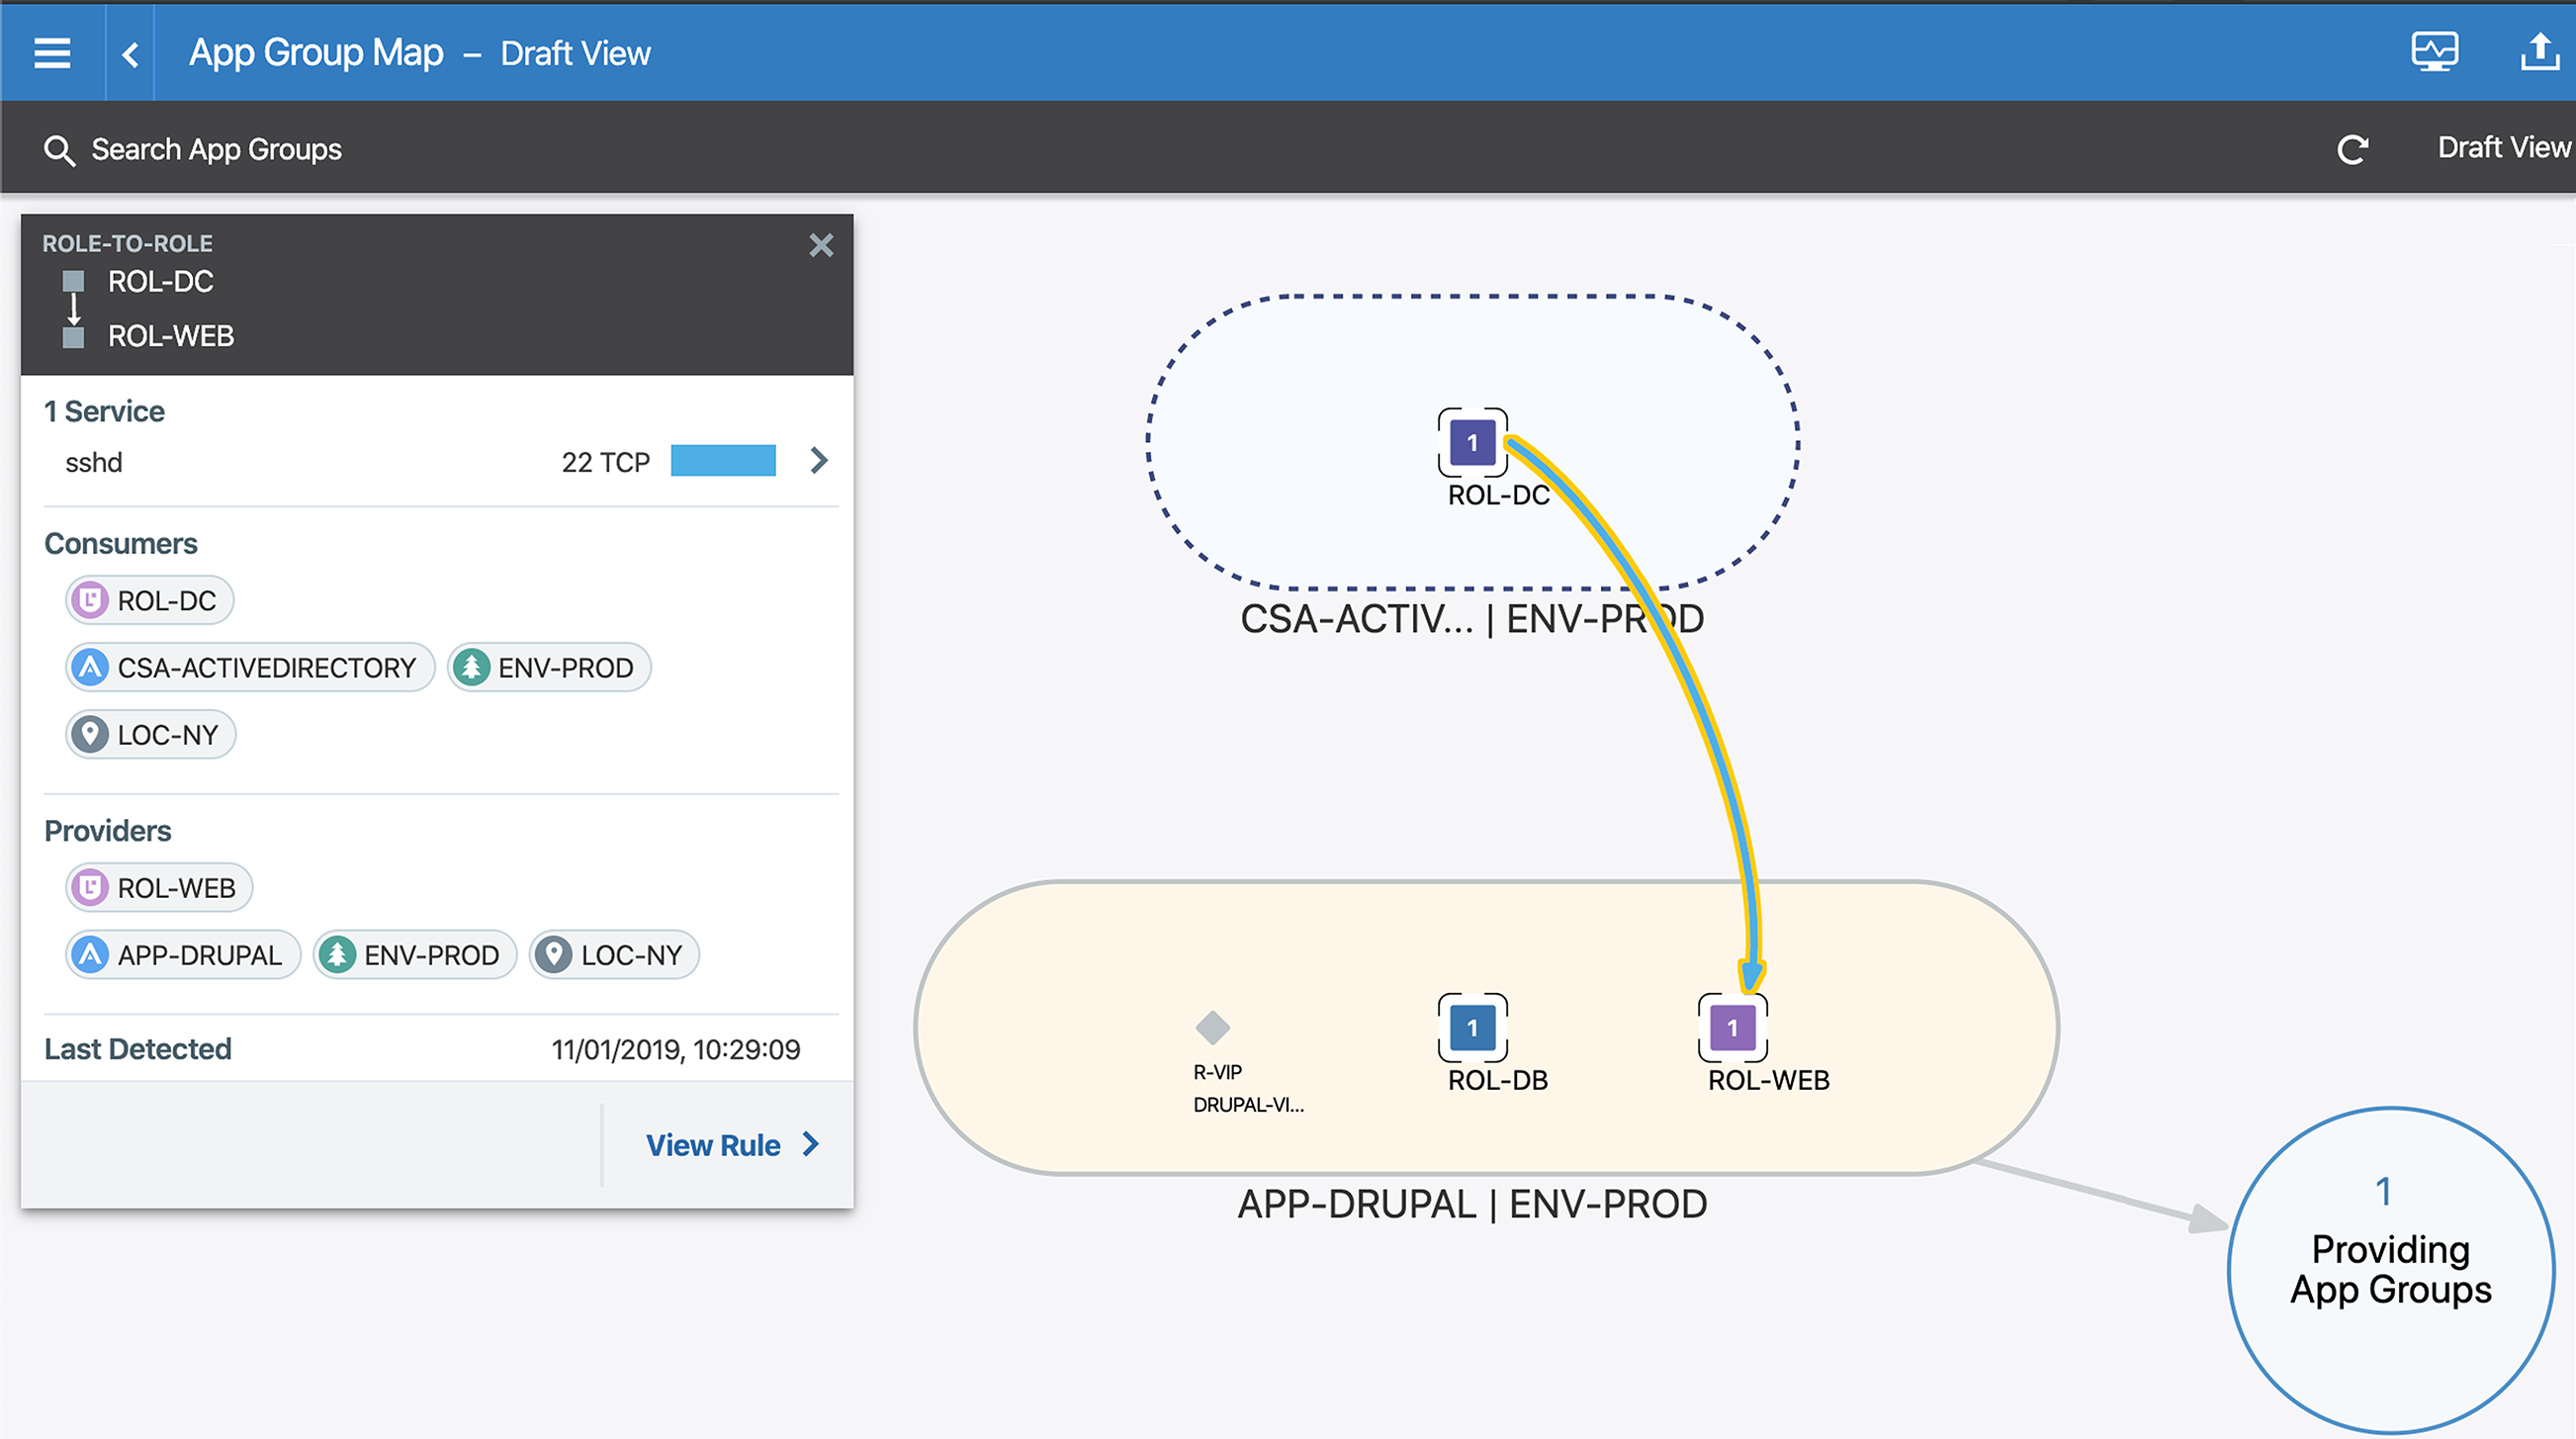
The App Group Map provides a way to view traffic to and from specific applications. Usually, customers prefer using this map when they want traffic information for specific applications. The App Group Map is especially valuable because it displays traffic flows from Consuming App Groups to your applications.
The Consuming App Groups bubble includes all app groups that your application is providing services to. The Providing App Groups bubble includes all services your application is consuming. Clicking the number in a Consuming App Groups bubble or Providing App Groups bubble allows you to review information about a specific app group communicating with your application or determine if the application is communicating outbound with another application.
Clicking a Consuming App Group or Providing App Group displays the traffic between the target application and the Consuming or Providing App Group. You no longer see the intra-scope traffic within the application. Clicking a traffic line displays the details of the traffic across that line.
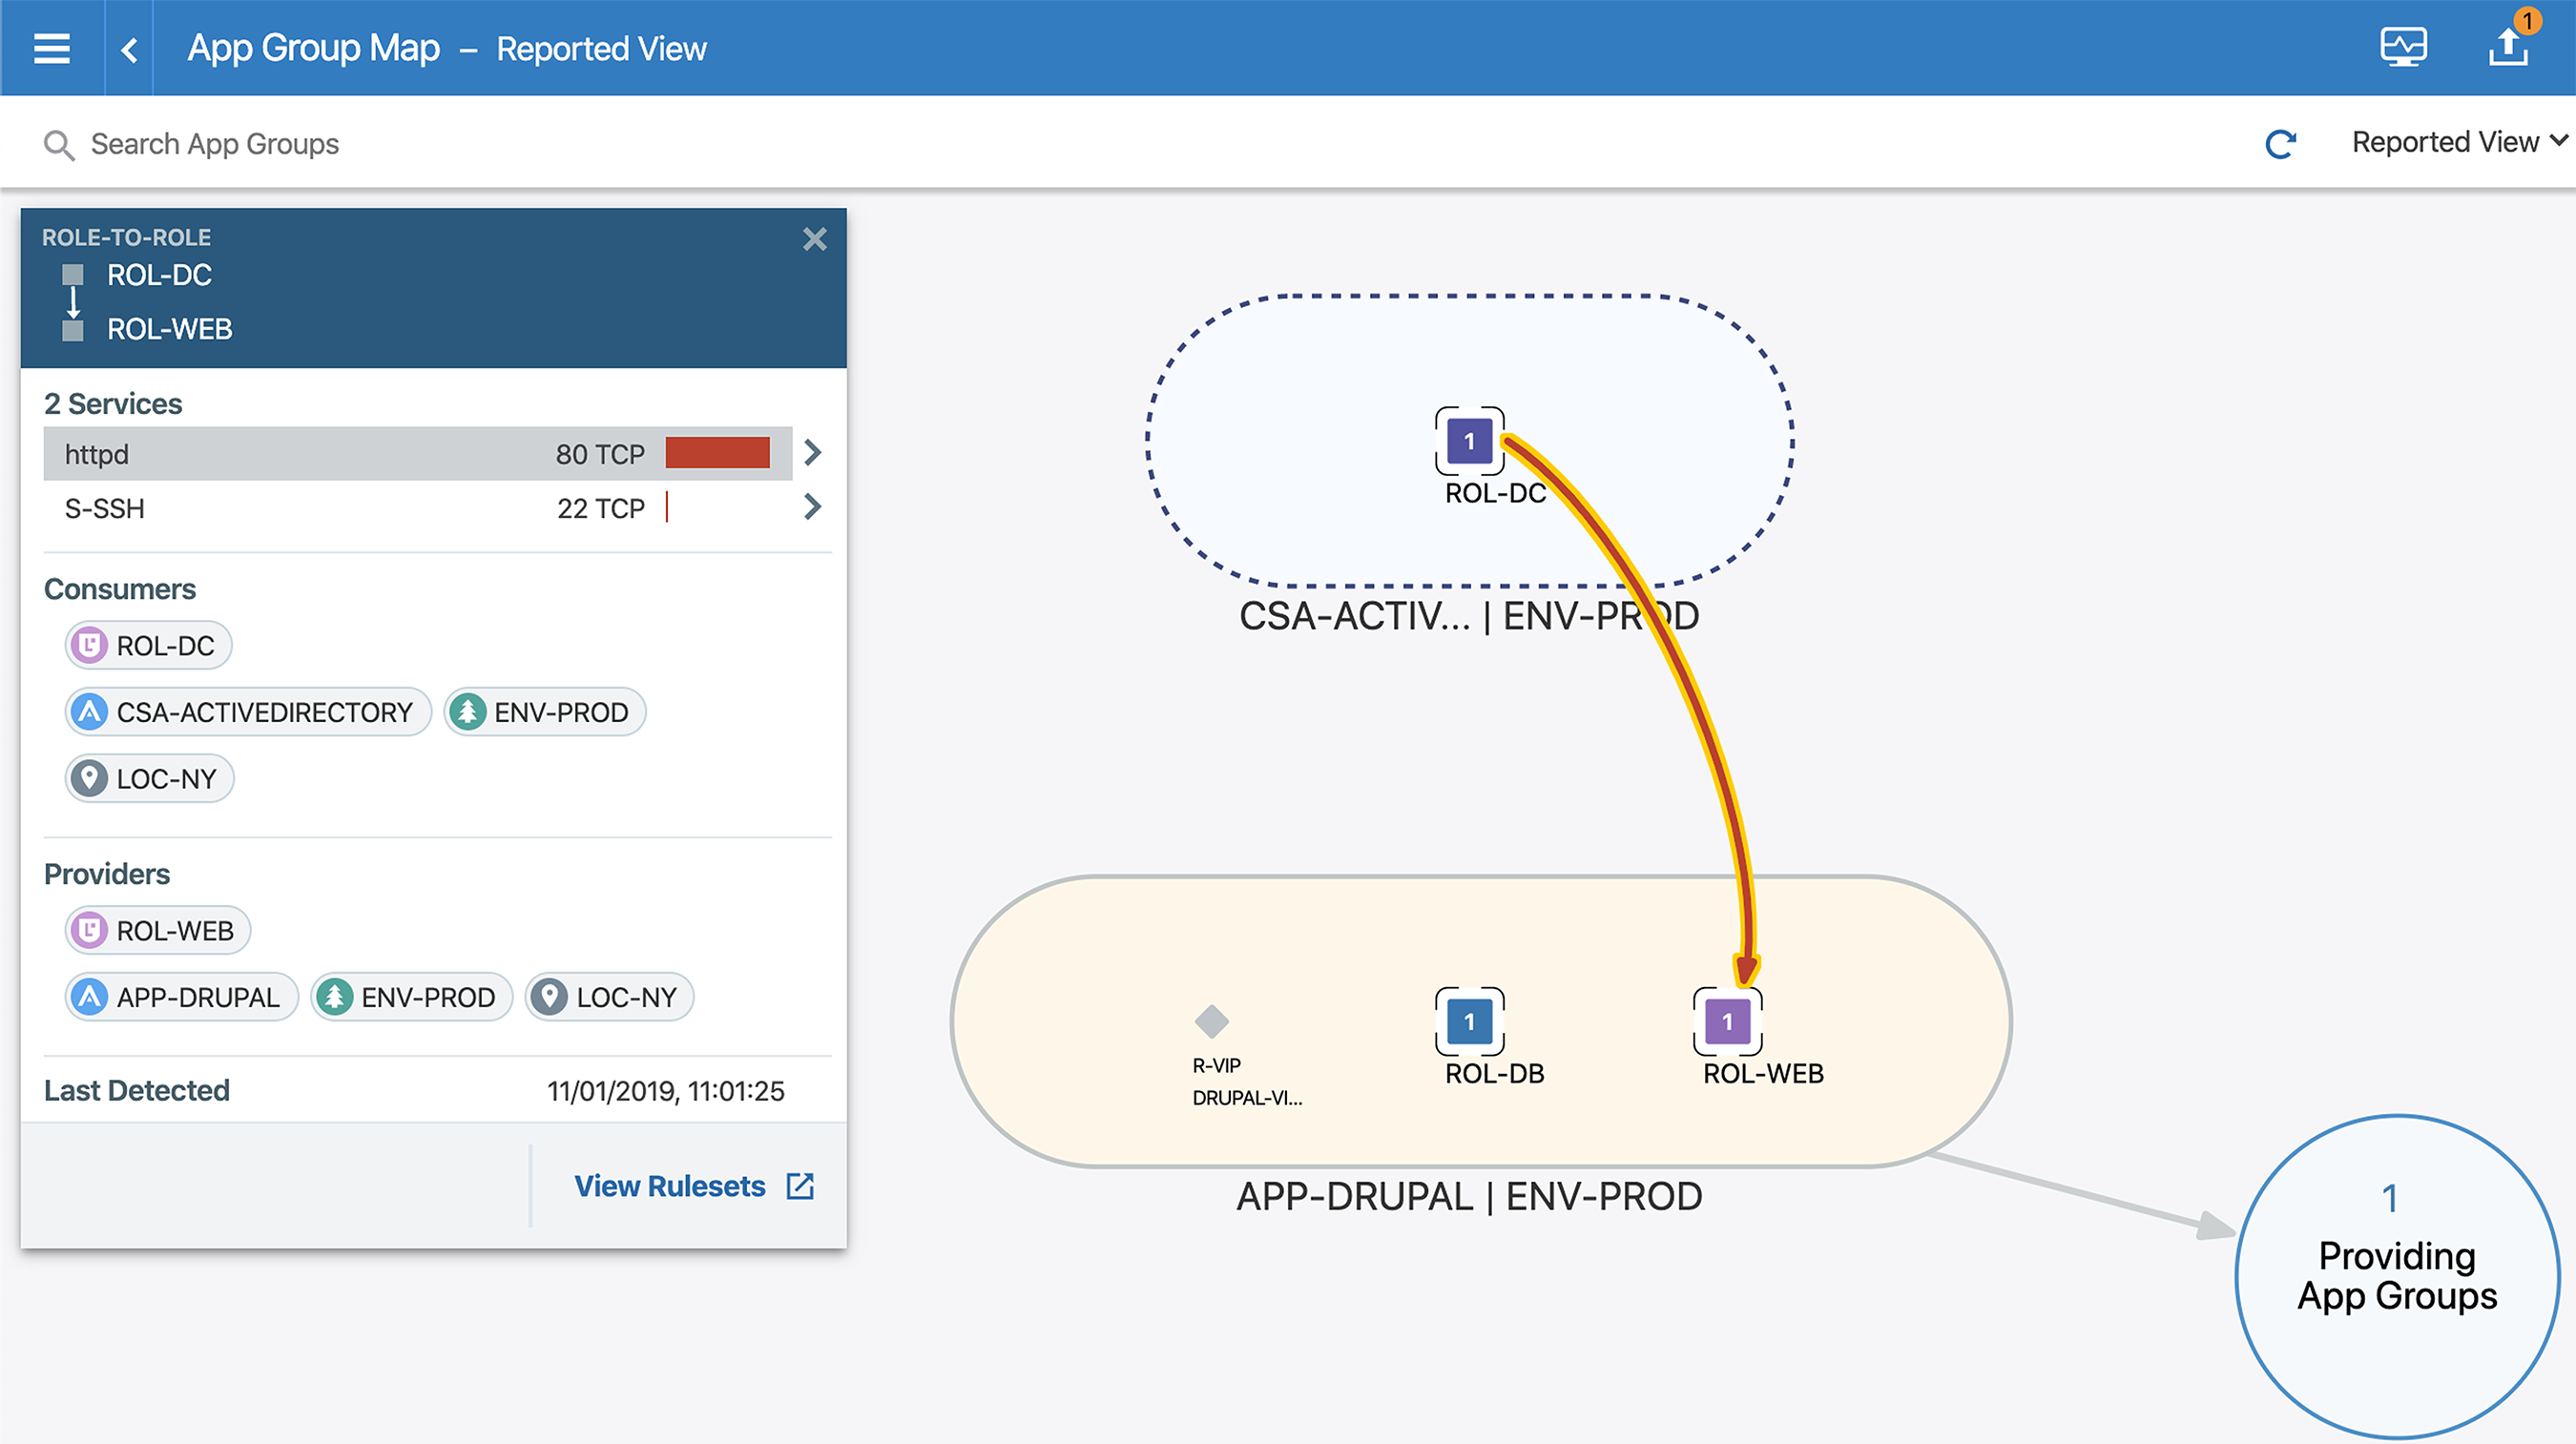
Select the Consuming App Groups bubble and click the red lines around it to see the ports and protocols that require rules.
By default, the App Group Map displays your traffic from inside your application and to and from IP lists and unknown traffic.
In this example, the traffic flow 22 TCP displays the reported service as sshd. To distinguish between reported services and service objects, Illumio recommends you adopt a label naming convention. See Labels and Label Groups for more information.
Create services that you can reuse in rules to make creating policy more efficient. See
See
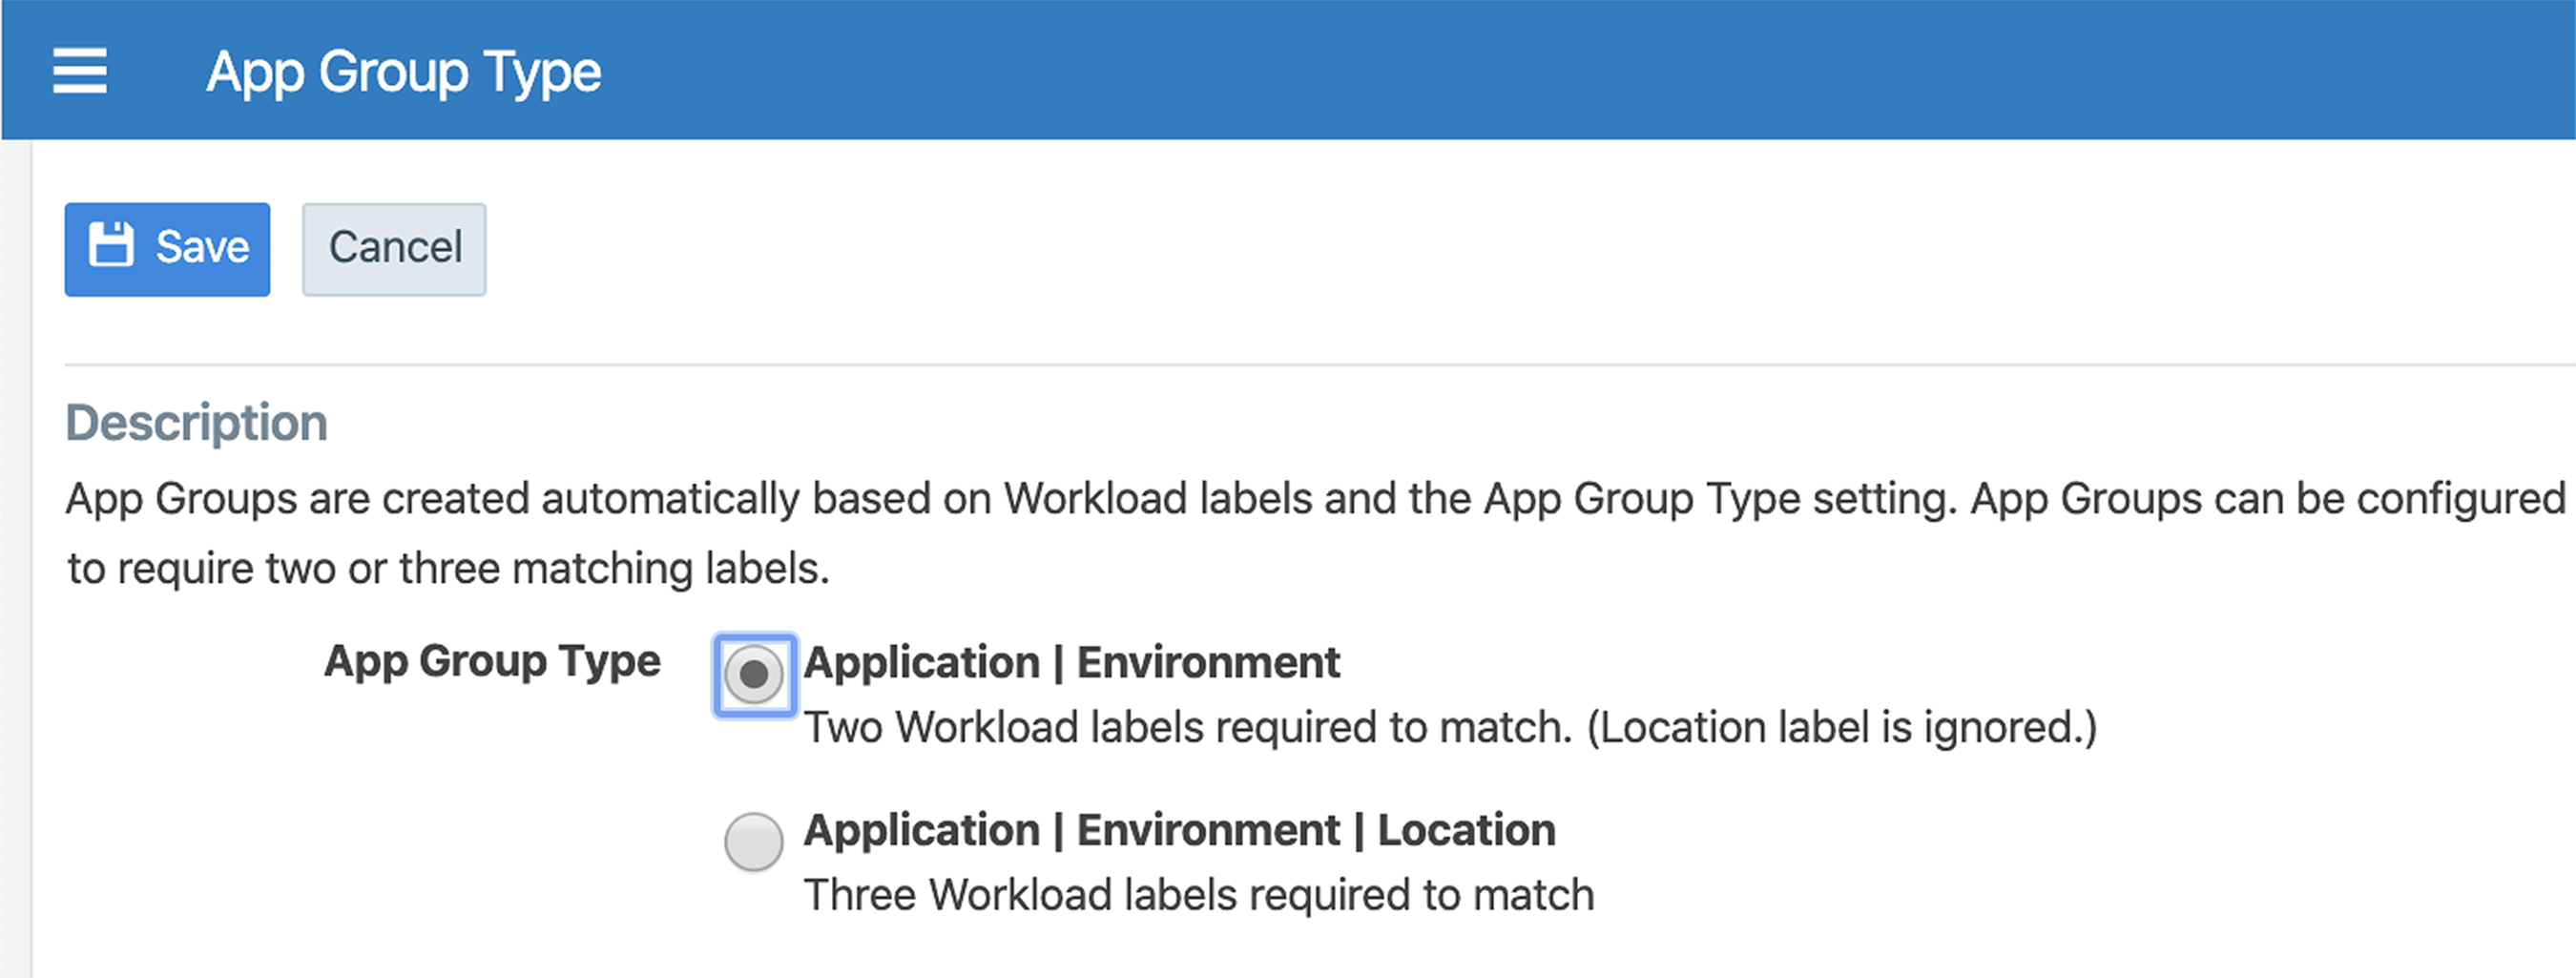
To globally include or exclude the location in all App Group Maps, set the App Group Type. Including the location displays a separate App Group Map for each location. Typically, you don't need to include the location especially when the same applications span multiple locations. (You must be a PCE global administrator to set the App Group Type.)
Explorer
The Explorer provides a historical view of your traffic flows. Use Explorer to search for different traffic combinations to and from any application. The information you obtain from Explorer helps you add the necessary policy for your applications. See
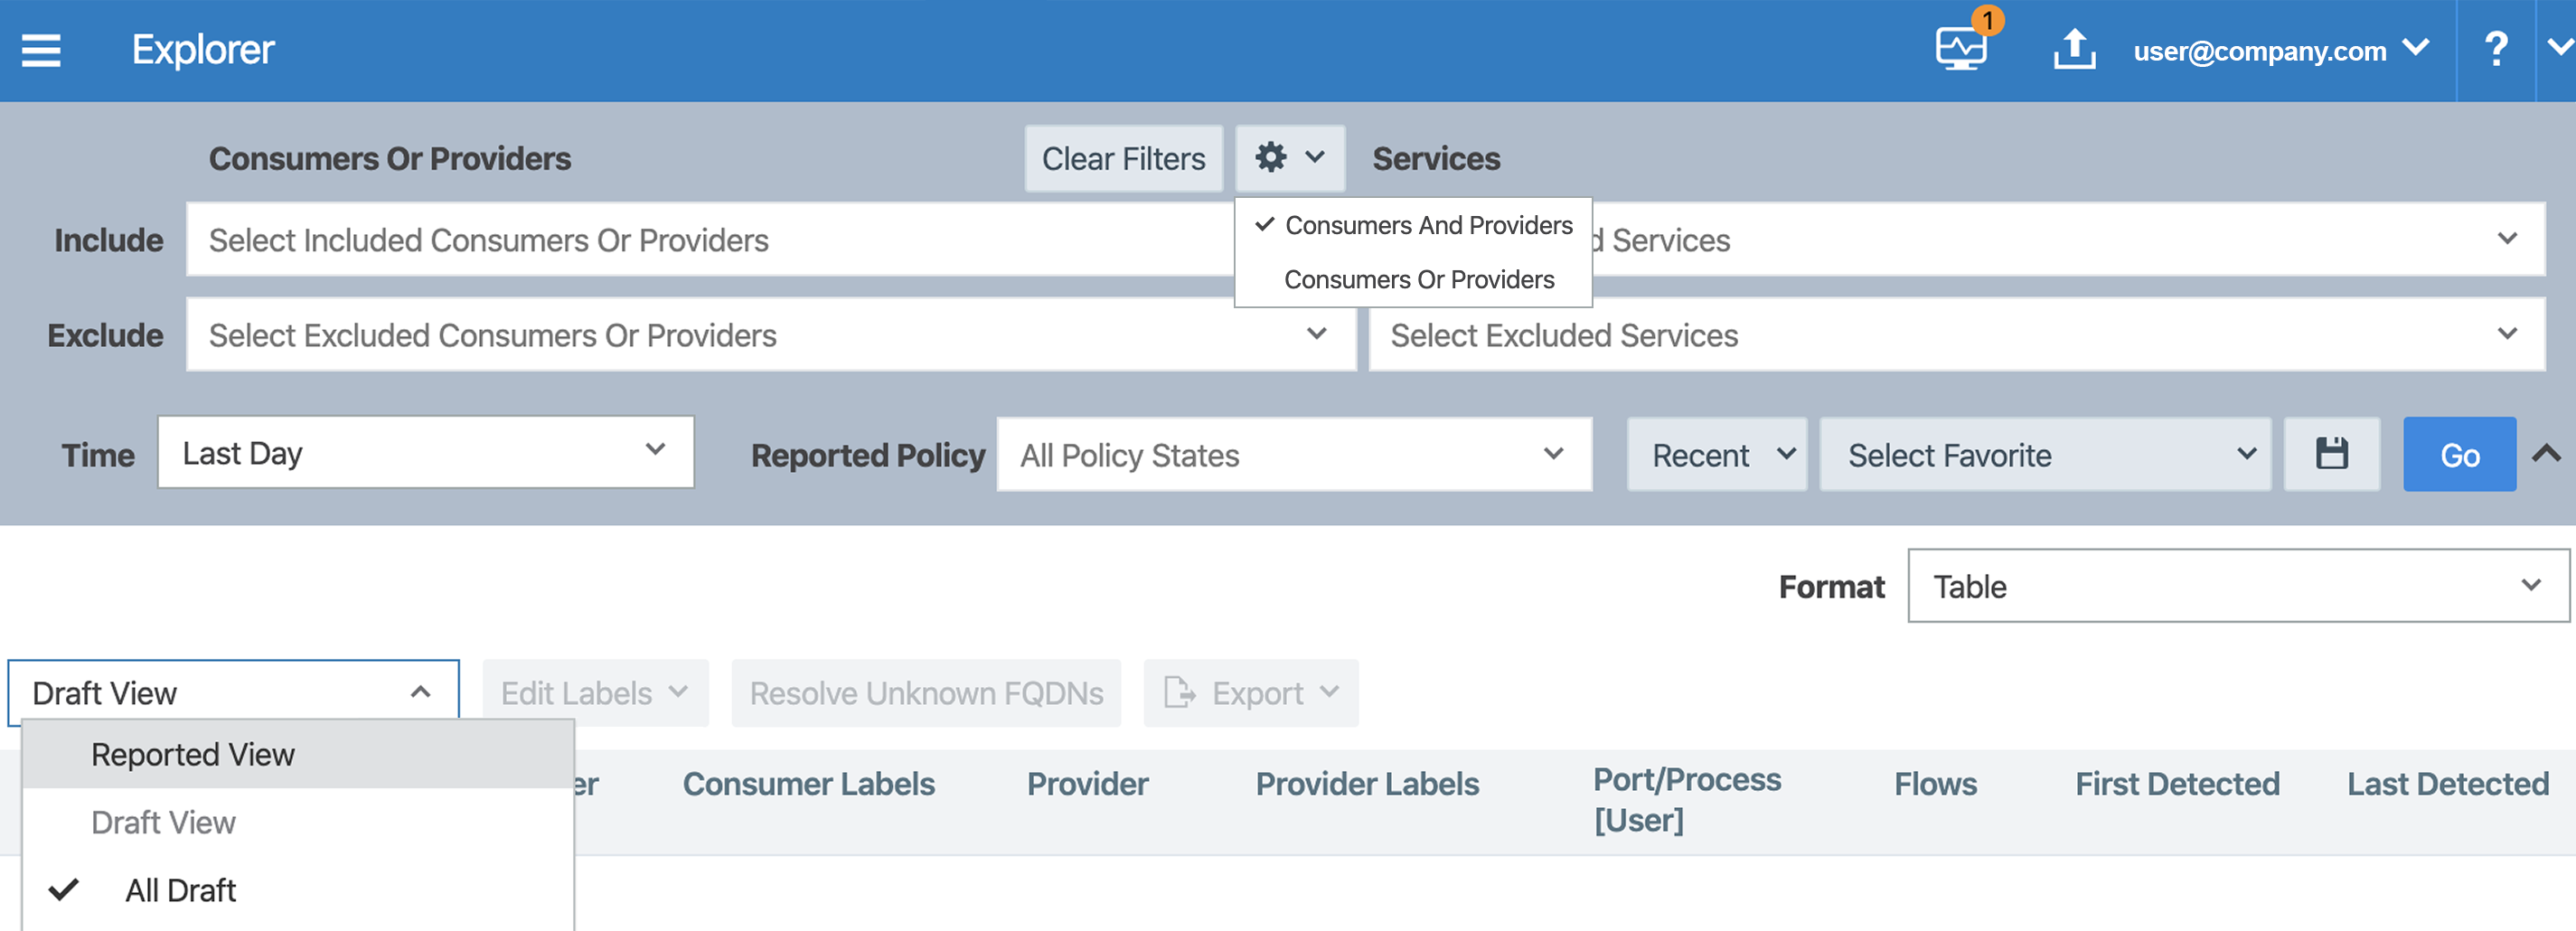
You can choose the way that Explorer displays traffic flow data:
- View the traffic flows your applications send and receive in tabular form or as parallel coordinates. When you view your traffic flows in tabular form, you can export your queries to CSV to analyze offline.
-
View traffic flow data for "Consumers or Providers" or "Consumers and Providers." When you choose "Consumers or Providers," Explorer displays the inbound and outbound traffic you specified in the Include field.
-
Use the "Draft View" or "Reported View" to view traffic flows. Having access to both views allows you to determine what traffic flows the Illumio Core will allow or block after provisioning your policy.
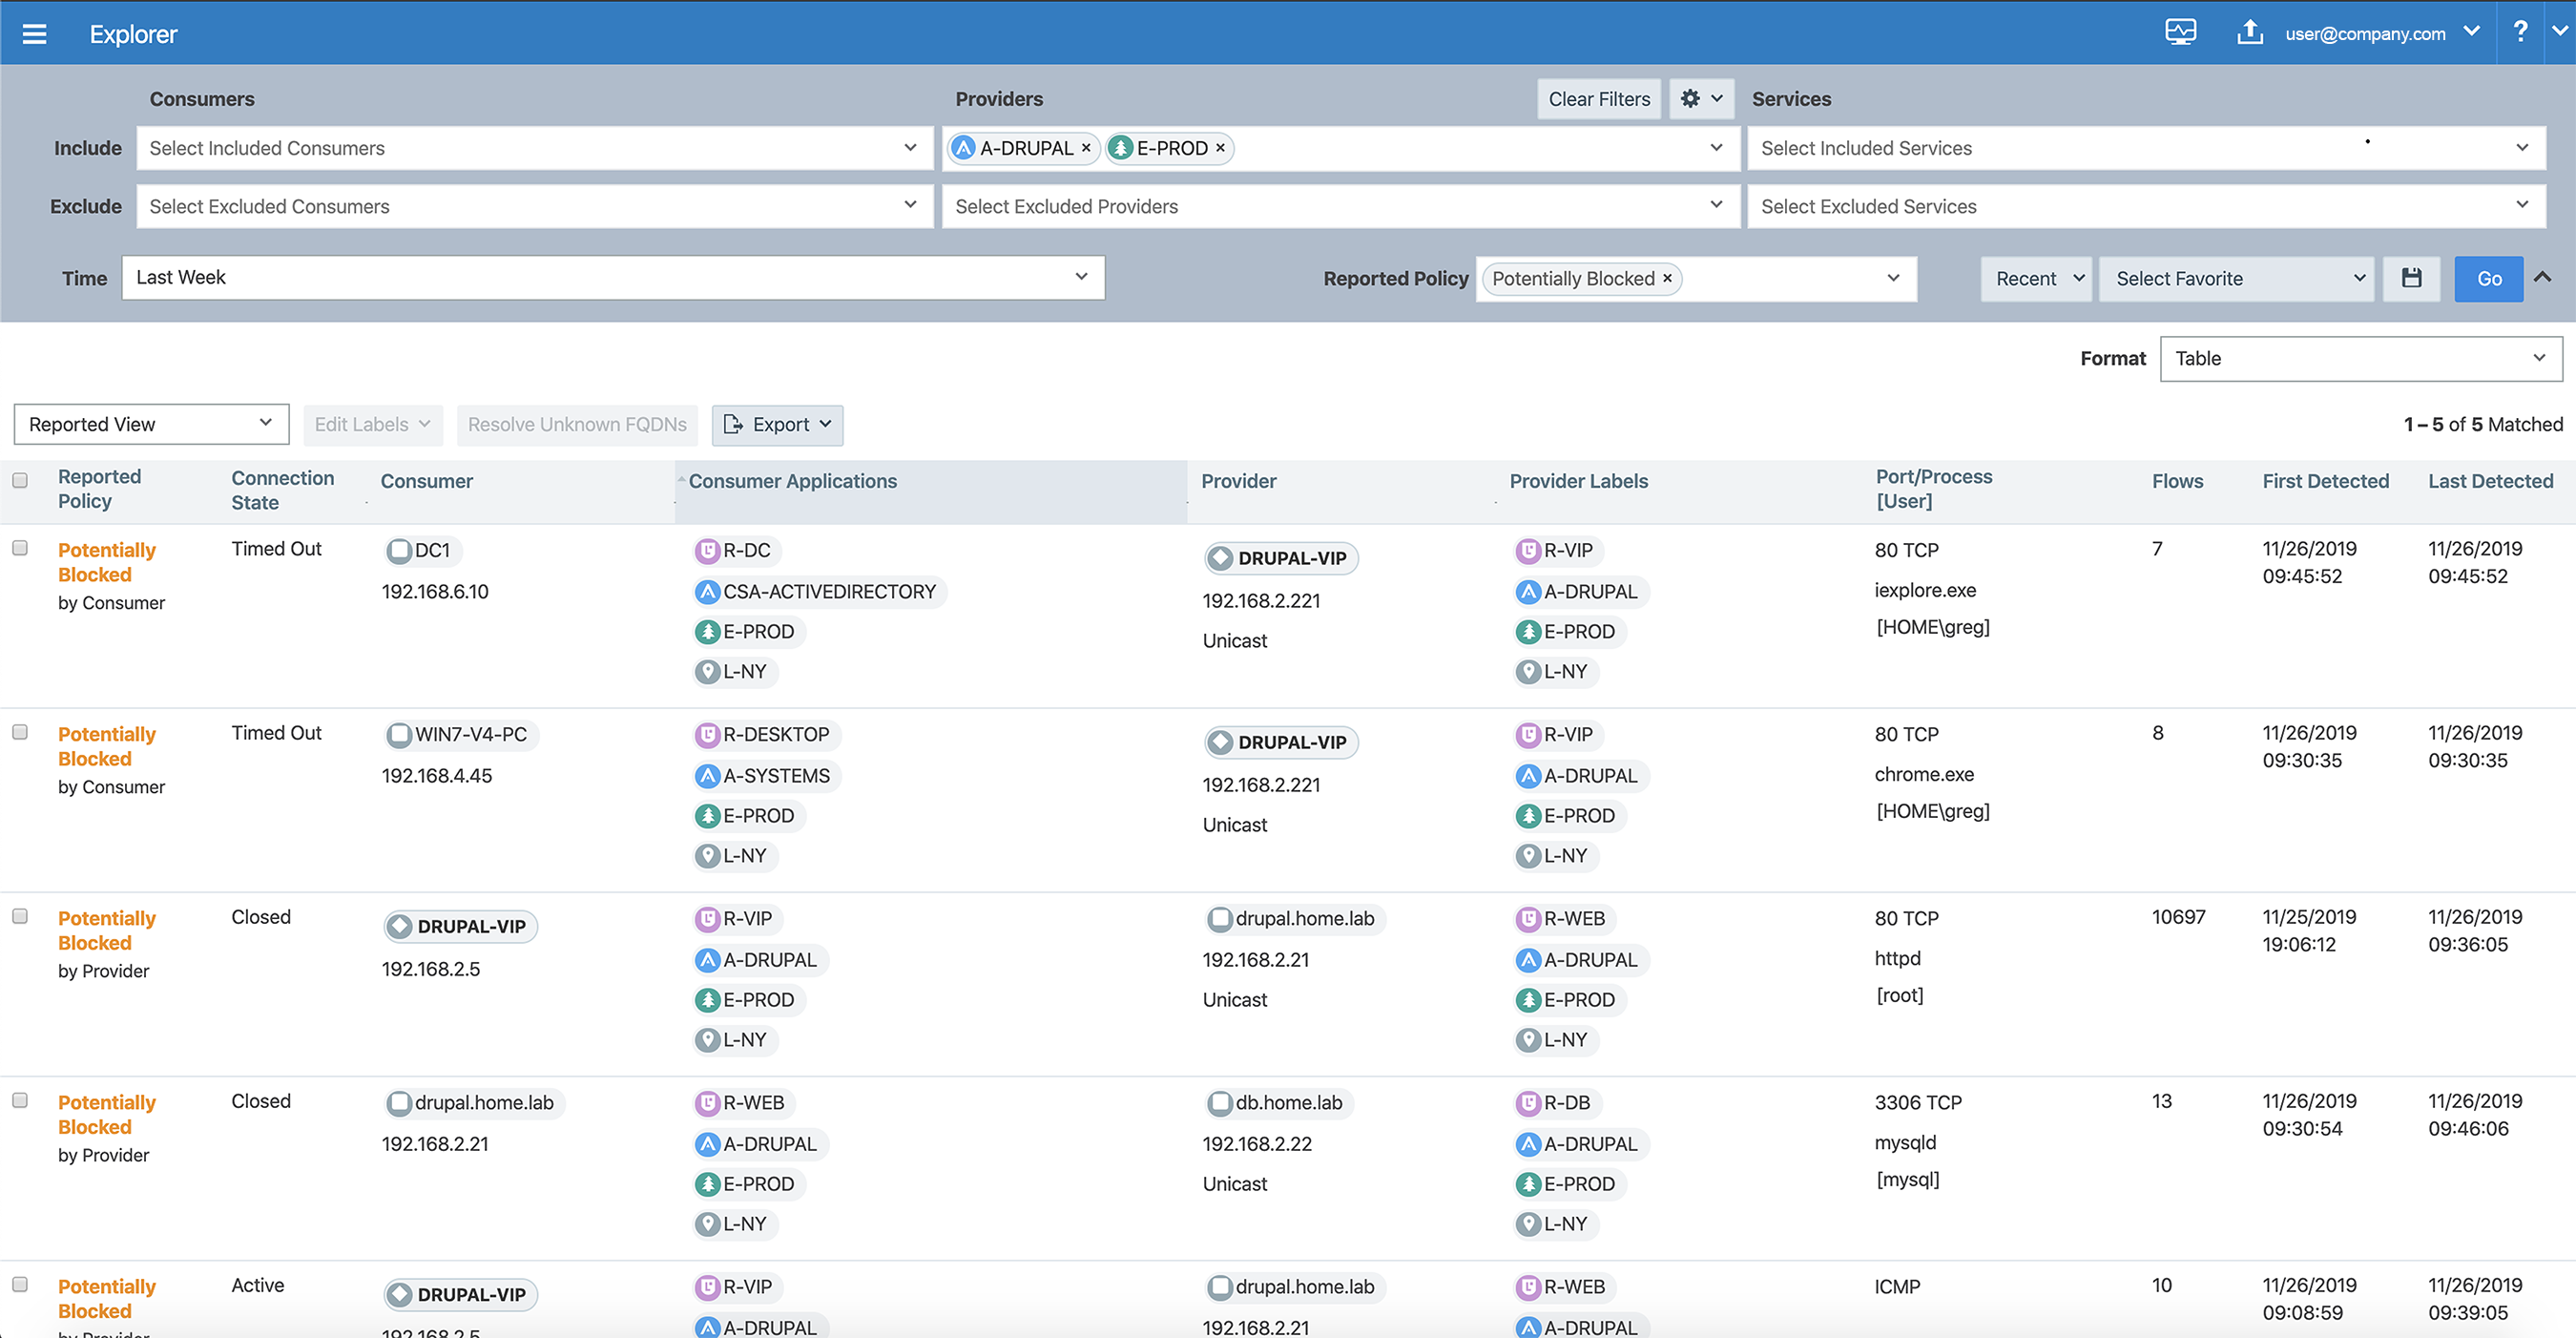
When you query Explorer, you will mostly want to look for Potentially blocked under Reported Policy or draft view - blocked traffic while building your policies.
Traffic Displayed for “Consumers Or Providers” and Draft View
- To help determine what policy to add for your applications, query Explorer for potentially blocked traffic by using the Reported Policy field or Draft view.
- To reduce the amount of traffic flows to analyze, exclude services or consumers.
Saving Explorer Filters
You can configure Explorer to filter out traffic flows that don't require policy. For example, Windows environments typically utilize protocols that generate a lot of traffic flows but don't require policy in most cases. You can save an Explorer query that excludes those protocols.
To save a filter, create your query with the excluded traffic flows, click the save ![]() icon, and enter a name.
icon, and enter a name.
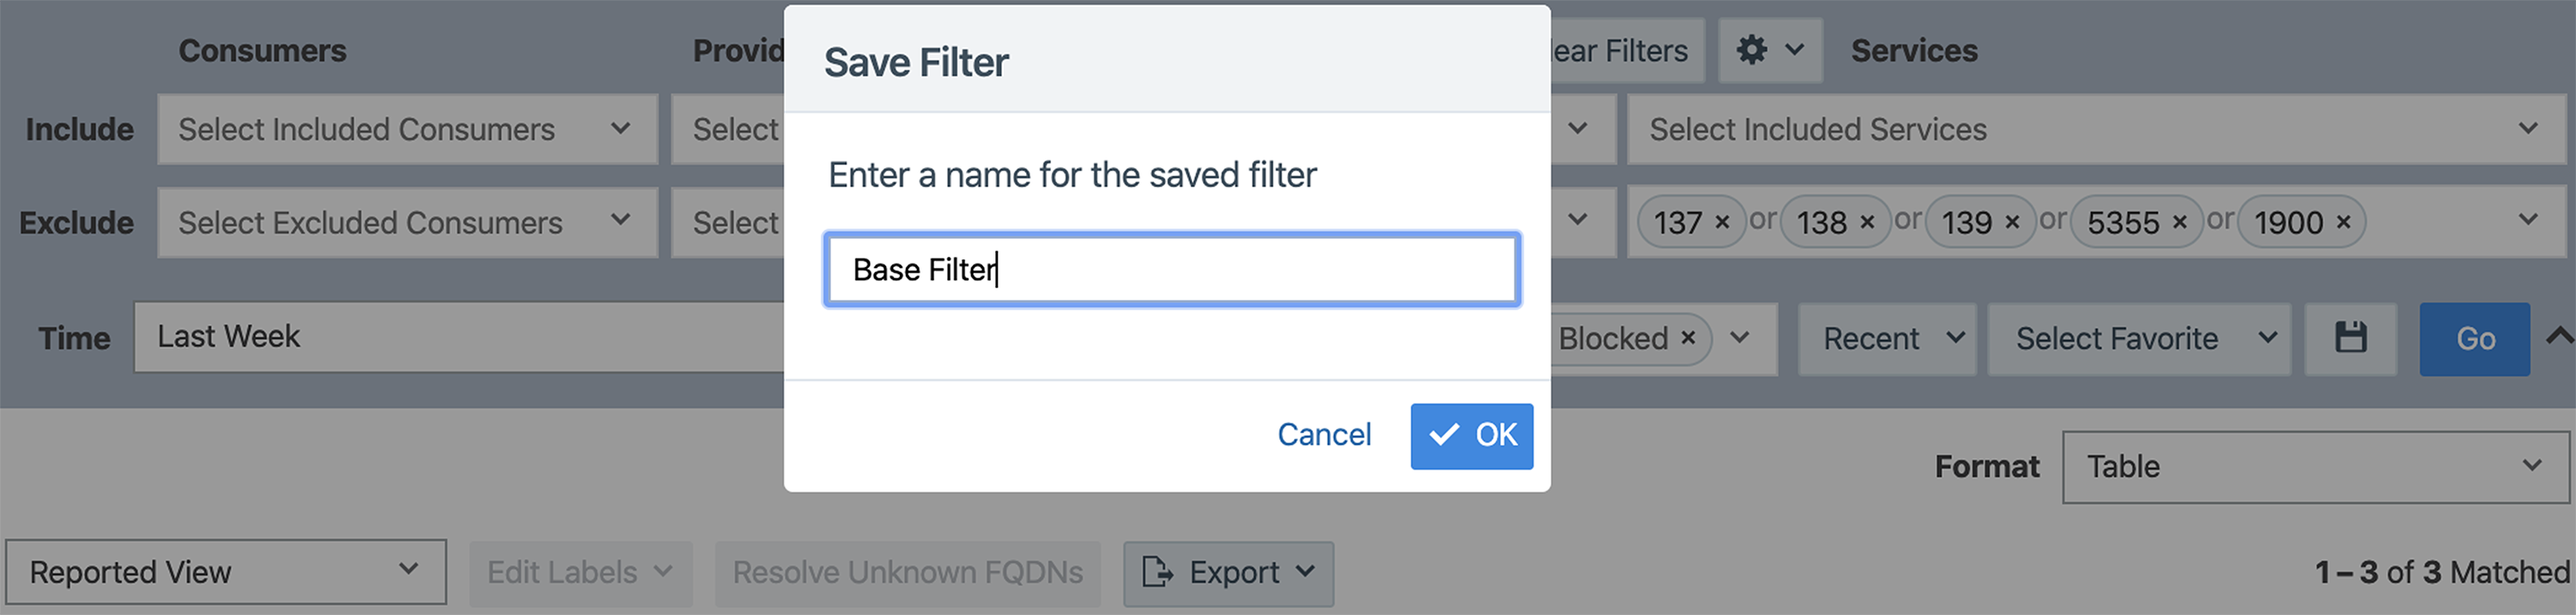
For example, you could create a base filter that excludes all three netbios ports, LLMNR (dnscache or link local multicast name resolution), and uPNP. To access a saved filter, select it from the Select Favorite drop-down menu.
Saved filters include the consumers, providers, time, and reported policy type specified in the Explorer query. Make sure to set them as part of creating a saved filter.
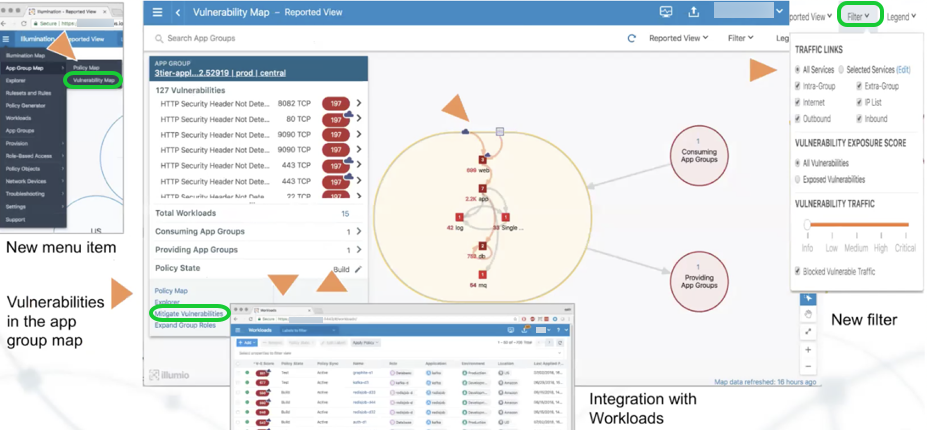
Vulnerability Map
Vulnerability management and micro-segmentation are foundational security controls of a successful cybersecurity strategy. Vulnerability Maps combines Illumio's Application Dependency Map with vulnerability data from Qualys Cloud Platform to provide insights into the exposure of vulnerabilities and attack paths across your applications running in data centers and clouds.
It integrates application-dependencies and network flows with the vulnerabilities on the host that are exposed on communicating ports.
See