You can use Explorer to search for information about your organization and to create unmanaged workloads. You can specify IPList (CIDR and FQDN) in the traffic_queries API and get results of all entities that match that IPList. If there are multiple IPLists matching a source or destination IP, the top five are displayed. You can also optionally specify (only available through API) a flag to obtain workloads, whose IP addresses are part of the specified IPList and have flows to/from the IP address. Explorer returns 5 matching IP lists by default, which can be expanded to 50.
Explorer Search Example
One preliminary method of creating policy is to make sure that different environments of your datacenter are segmented from each other. For example, you can separate Development or Testing environments from your Production environments. Before you write policy rules to either allow or block this traffic, you want to determine if there are any traffic flows between them.
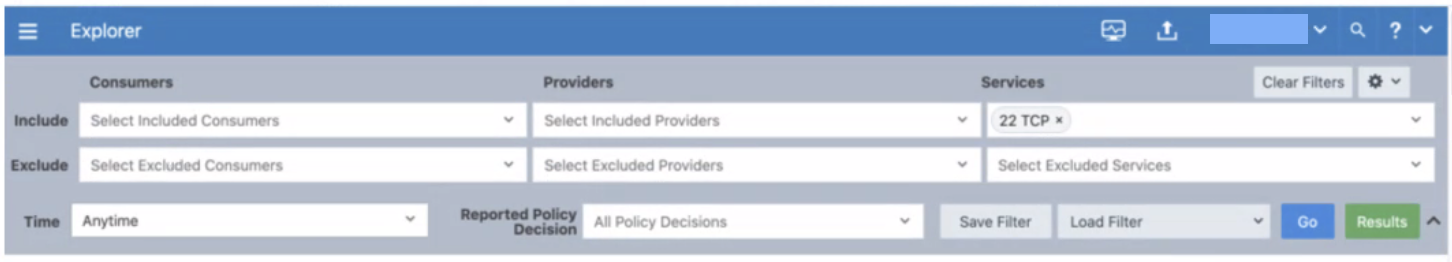
Using Explorer you can query, for example, the following:
"any traffic flows during the last week between my Development and Production environments, over any port except port 80, excluding any workloads that have a Role label named ‘Domain Controller’"
Example search using Explorer:
-
In the PCE web console menu in the upper left corner, choose Explorer.
The Explorer page appears.
- Under Consumers, enter or select the Environment label named “Development” from the Include drop-down list.
- Under Consumers, enter or select the Role label named “Domain Controller” from the Exclude drop-down list.
- Under Providers, enter or select the Environment label named “Production” from the Include drop-down list.
- Under Providers, enter or select the Role label named “Domain Controller” from the Exclude drop-down list.
- Under Port/Protocol, leave the Include field blank (which means “any”) and under Exclude enter “80.” One of the options is also ICMPv6.
- Under Time, select Anytime.
-
Click Go.
The results appear when the search criteria is met.
Asynchronous Queries
Asynchronous queries allow you initiate multiple queries in parallel and view the results of the queries at a later time. Prior to Release 21.2.0, going offline during a query would result in lost query results. Starting with this release, whether you remain online or offline, the results of asynchronous queries will be preserved for a period of 24 hours. In addition, while a query is in progress, you can work in other areas of the product. The query search results can be exported to either a comma-separated-value (CSV) file or displayed in the Explorer Web Console. Depending on the size of the query, the results may take time to display.
In this release, Explorer enables you to run multiple queries and allows you to change or retain the default file name for exported results.
- Multiple Queries–You can run multiple queries, including running some in the background.
If there is only one query, the results of that query will display when the query completes.
If there are multiple queries, you may select the result that you wish to view by clicking the number beside the Results button.
If identical queries are run within a minute of each other, only one query will be processed. The results of the oldest query will be displayed.
- Default File Name–The system assigns a default file name based on your query field names (Consumer, Service, or Provider) in the filter. The exported file will have the same name.
Giving filters a unique name will help you identify your filters when you wish to rerun a query. This name will also appear as your report name.
You can also specify or change a filter name as desired.
Handling Duplication Flows in Queries
A database query that spans multiple days can contain duplicate flows if the flow is repeated.
Prior to Release 20.3, these duplicate flows were merged together outside the database, and could have resulted in fewer results being returned to the user interface.
From Release 20.3 and later, duplicate flows spanning multiple days are merged in the database, allowing more unique flows to be returned.
Run Asynchronous Queries in Explorer
Asynchronous job queries are easy to initiate and can be run in parallel, which means that before the first query completes, a second query can be initiated. In the following example, two queries are initiated; the first, with Production-only entries, and the second, with Production and Staging entries.
To run a query, proceed as follows:
-
From the main menu of the Web Console, navigate to Explorer.
-
Enter your query criteria in the Include field.
You can enter a Consumer, Provider, or Service, or merely indicate Production in the Provider column.
- Click Go to begin the query process.
- To process a parallel query, click Go again.
- In the confirmation dialog box, click Hide.
- Enter the next search criteria based on a new Provider. For example, Production and Staging.
- Press Go.
-
Given support for asynchronous queries, you will see a number appear next to the Results button, indicating the number of simultaneous queries being processed.
Depending on the size of the queries, your second query may complete before your first query.
-
To view the results of your queries, click the Results Available pop-up that will appear in the bottom-right corner of the PCE Web Console.
You will see the results of your two queries, one with Production-only entries and a second with Production and Staging entries. At any time, you may click the Results button to view what queries were run.
Viewing results from past queries will not re-initiate a query. It will display cached query results. When you select a result, notice that the filter changes automatically, and displays new results.
View and Modify Query Result Settings
You can view results from the Results button, Results Available pop-up, or the gear drop-down in the upper-right corner of the Web Console.
In the Results window, when you see an asterisk in the Connections column, it indicates that there are more entries in the database than what you requested in your query.
To view additional results, you must increase the values in the Results Settings menu. You can access this menu from multiple locations; from the gear drop-down or your user profile drop-down.
-
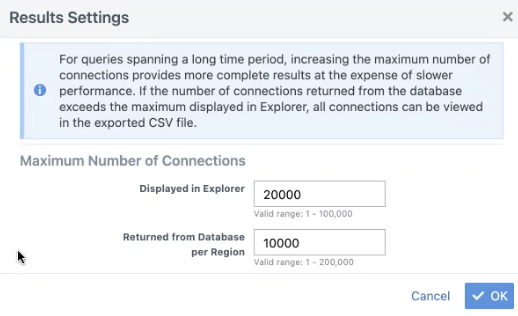
From the upper-right corner of Explorer, click the gear drop-down to view the Results Settings window.
-
From Results Settings, change the value for maximum connections.
You can change the number of connections for what can be 'Displayed in Explorer' or 'Returned from the Database per Region'. Up to 100,000 can be 'Displayed in Explorer' and up to 200,000 can be 'Returned from the Database per Region.'
Export Query Results
There are multiple locations from where you can export results. Depending on the location from which you export results, the number of results that are shown may differ. The number of results from Explorer may differ from the number of results returned by the PCE web service.
In the Web Console, you can display additional data if you include draft rules and FQDN look ups.
Export from the Explorer Web Console
From the central pane of the Explorer window, you can export query results with enhanced information.
-
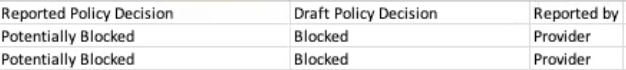
From the Reported View drop-down, choose Draft View.
This will include Draft Policy Decision (All Draft, Blocked, or Allowed) entries in your exported file. If you do not make a selection, you will receive information on the Reported Policy Decision results.
-
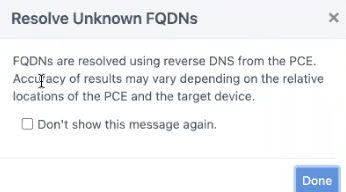
Click Resolve Unknown FQDNs to export FQDN information for unknown IP Addresses and Done from the confirmation dialog box.
-
Click Export. This button appears next to Resolve Unknown FQDNs.
NOTE:Clear cached FQDN values and reload the results if you do not find relevant information.
Depending on the number of draft rules, the data may be slow to load. Once it loads, columns called Draft Policy Decision and Reported Policy Decision will be populated with data and will appear in the exported zip file.
Export from the Results Button
Once your query completes and results are available, you can export these results to a CSV file.
- Click Results to view the list of your queries.
- Click the query result list item to view the results for a particular report.
-
Click Export to gather your data in a CSV file.
When you create a direct export from the Results list, you will receive Reported Policy Decision entries in the report. This report will not contain Draft Policy Decision entries or FQDN information.
Global Explorer for Superclusters
Explorer is referred to as Global Explorer in the context of Superclusters.
Global Explorer leverages the capabilities of asynchronous job queries for every region in a Supercluster. If you have a Supercluster and you initiate a query from the Supercluster leader, Explorer will display results from all its members. Queries run from a Supercluster member will only show flows reported by VENs paired to that member.
Note that the maximum number of results that can be retrieved from the PCE database has changed. In a Supercluster, a query run on the leader PCE can return 200,000 results for each PCE in the Supercluster, including the leader. For example, in a Supercluster with four regions, the maximum is 800,000, and in a stand-alone PCE, it is 200,000. When logged in to a member PCE on a Supercluster, the limits are the same as for any SNC or MNC. In every case, the maximum number of results that can be shown in the Web Console is 100,000 results, as in earlier releases. If more than 100,000 results are retrieved, the full results are available as a downloaded CSV file, and the first 100,000 are available in the Web Console.
Create Unmanaged Workload from Unmanaged IP Address
After you convert an unmanaged IP address to an unmanaged workload, you can use it in your policy; for example, you want to allow one of your hosts to communicate with a managed workload. A reverse DNS lookup is done on the IP addresses listed under the Consumer column and you see the name of the server instead of the IP address.
The DNS names are not displayed in Explorer for Illumio Secure Cloud customers.
To create an unmanaged workload from an IP address:
-
In the PCE web console menu, choose Explorer.
The Explorer page appears.
-
On the right side of the page, from the Format drop-down list select Unmanaged IP Addresses.
If you have a reverse DNS lookup, the server name is used instead of the IP address.
-
Click Go.
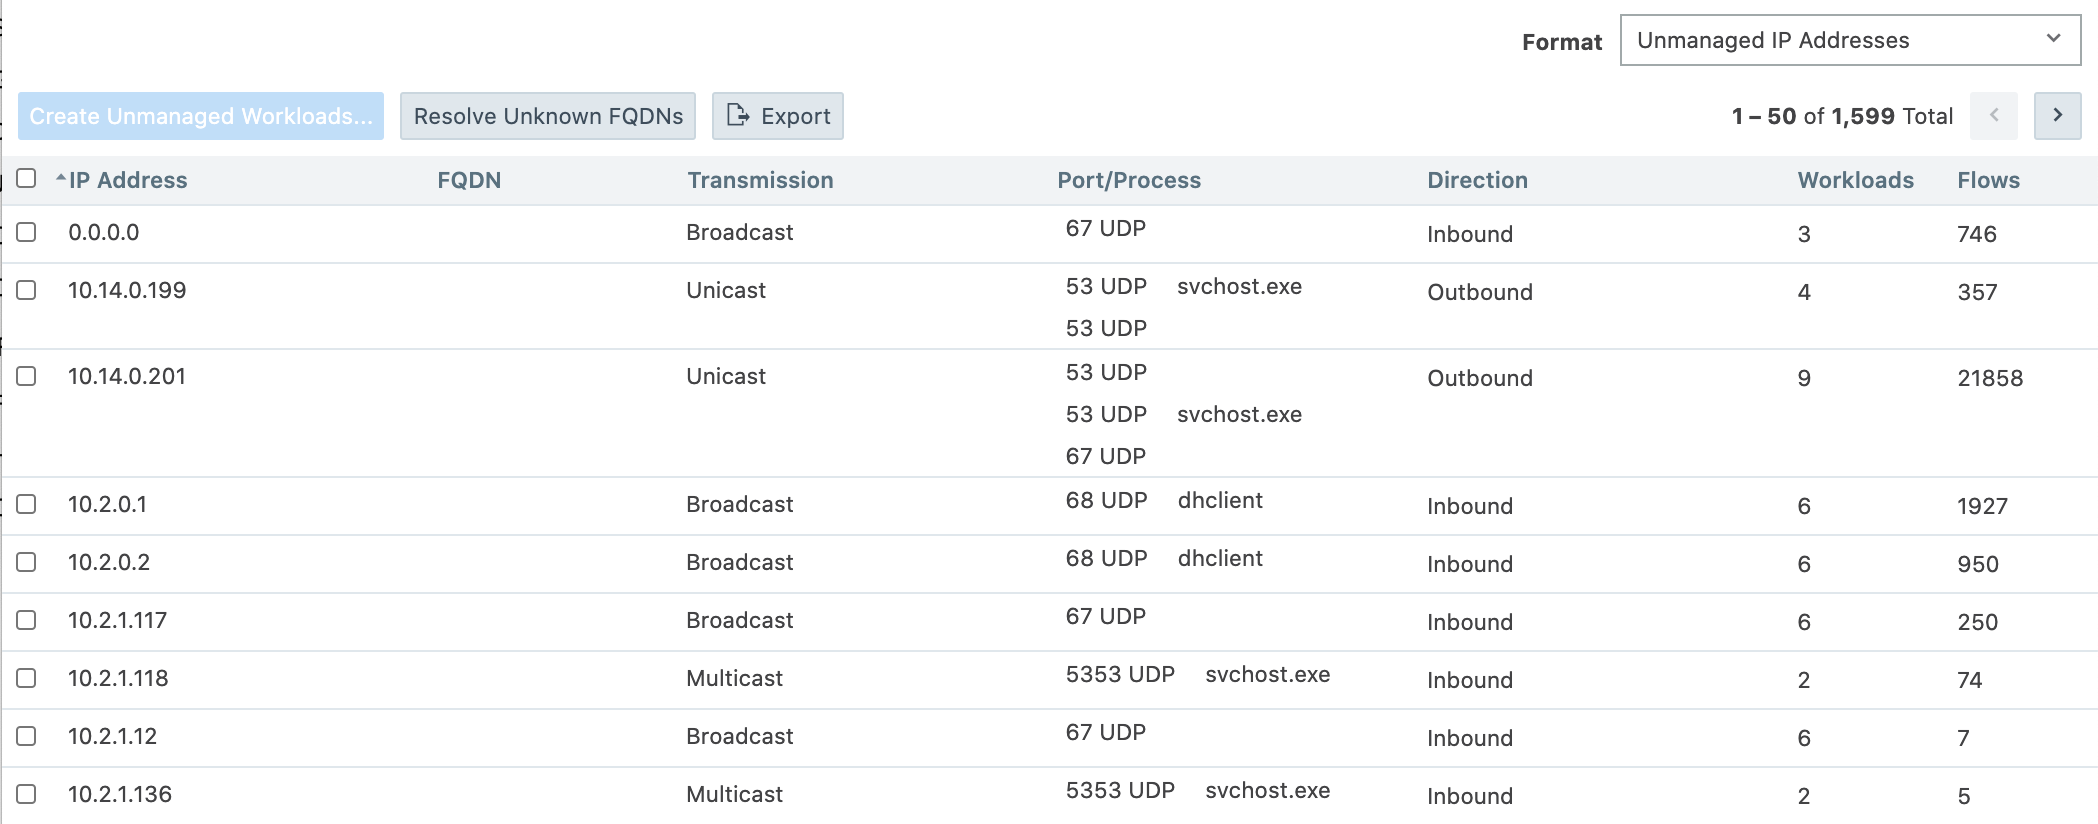
The results display any unmanaged lP addresses that are communicating with your managed workloads.
- To convert an IP addresses into an unmanaged workload, select the checkbox next to the IP address and click Create Unmanaged Workloads.
-
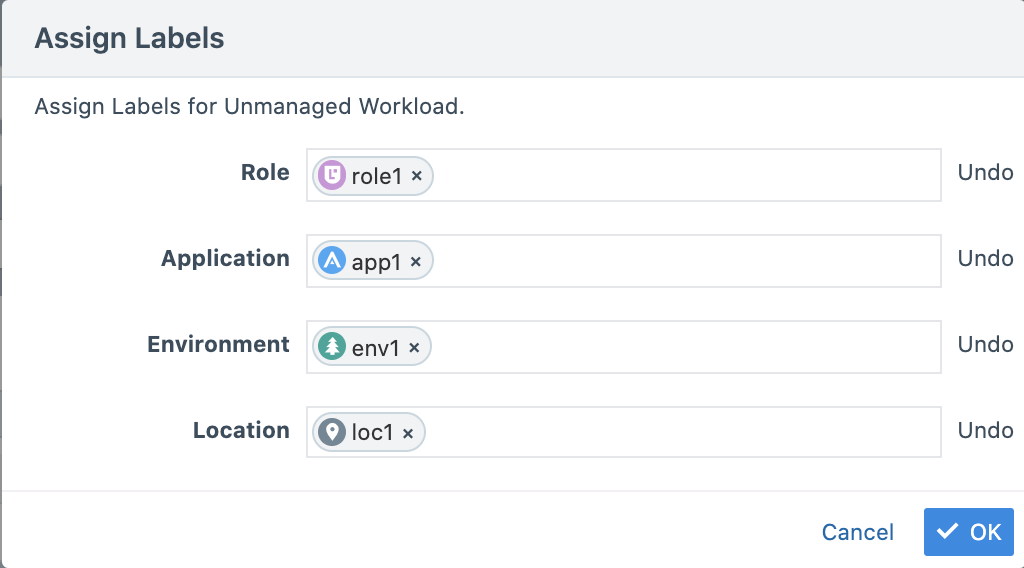
In the Assign Labels dialog box, assign labels that you want to assign the unmanaged workload and click OK.
The new unmanaged workload is created.
-
To complete the configuration of the unmanaged workload, choose Workloads from the PCE web console menu.
The Workloads page appears.
In the Workloads list, you can identify the new unmanaged workload by its name, which is its IP address.

The new unmanaged workload does not list any information for its enforcement because it does not have a VEN installed on it.
-
To complete the configuration for the unmanaged workload, click its IP address in the Workload list.
The Unmanaged Workload page appears.
- Click Edit and complete the workload information.
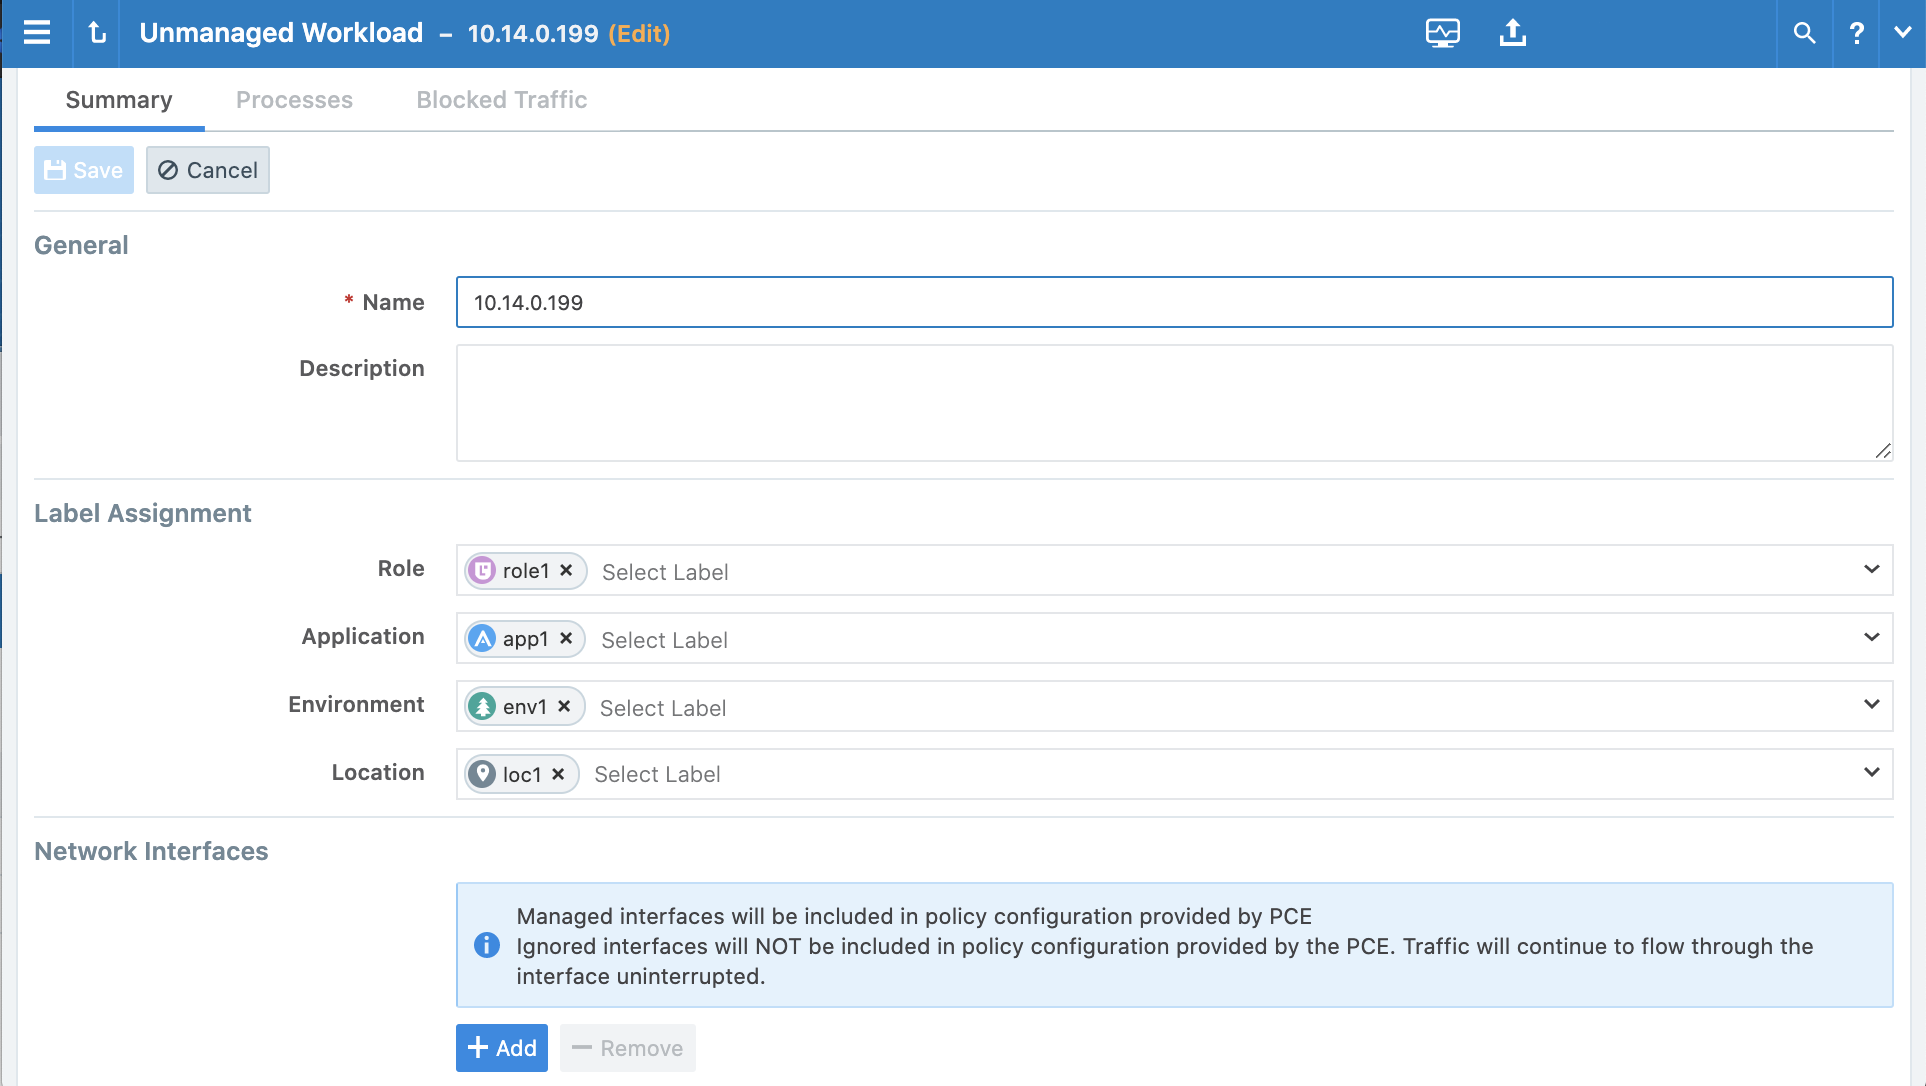
- Click Save.
Monitor Traffic Database Size and Receive Alerts Using Explorer
Using Explorer, you can monitor traffic database size and be alerted when you are close to capacity.
The storage information is based on your customer organization limit and not the overall capacity of the PCE for your Cloud environment.
To monitor traffic database size:
-
In the PCE web console menu, choose Explorer.
The Explorer page appears.
-
From the top status bar, click the database icon:
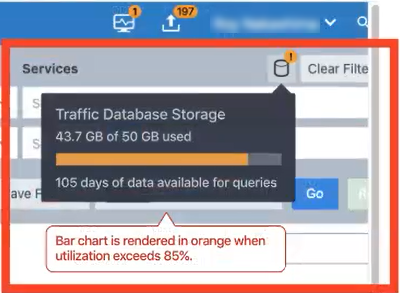
A pop-up window appears, which displays the amount of disk space your traffic data is consuming and how much space you have available. The feature also displays how many days of traffic data you can query and how many more days of data you can store. You receive an alert when your disk space is within 15% of your available space.
Add Rules for Traffic Flows Using Explorer
You can use Explorer to add rules for traffic flows by selecting traffic flows and then allowing the selected connections.
In Explorer, you can only write rules for one page of traffic flows at a time. You must click through each page. (This limitation matches the way other tasks are performed in the Explorer feature.)
To add rules for traffic flows:
- From the PCE web console main menu, choose Explorer.
-
From the View and Connections drop-down menus on the top left of the page, select an option under Draft View and Label-Based Connections.
The Allow Selected Connections button below the drop-down menus changes color to light blue indicating that the add rule capability is now available in Explorer.
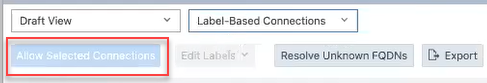
-
Using the checkboxes, select traffic flows that you want to write rules for.
The Allow Selected Connections button changes color to bright blue and includes the number of allowable connections that the PCE can write rules for.
NOTE:The count of connections by the button could mismatch the actual number of flows selected; for example, in these scenarios:
- Some of those flows are historical flows displayed for deleted workloads because you cannot write rules for those flows.
- Role-based access control impacts whether the user has the permission to write rules for all the traffic flows selected; you have access to the consumer side of the traffic flow but not the provider side.
The count value attached to the button reflects situations like these.
-
Click Allow Selected Connections.
NOTE:Under certain conditions the button won’t be enabled; for example, you’ve only selected traffic flows that are already allowed. When this occurs, either select other traffic flows or click the Edit Labels button to modify the traffic flows.
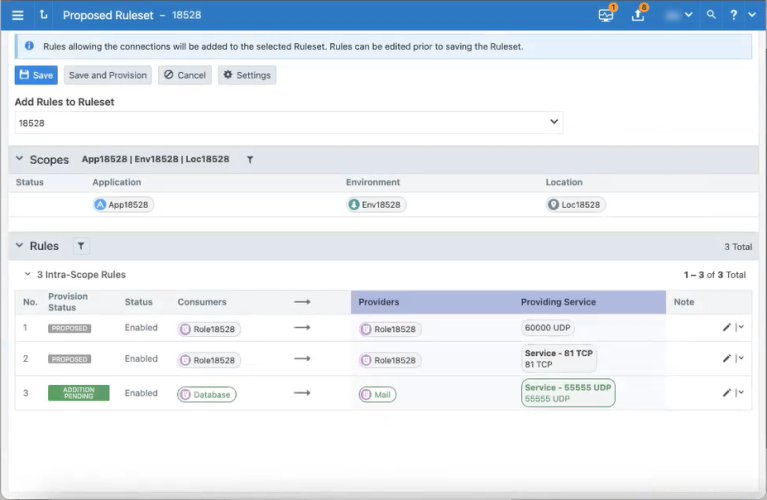
The Proposed Ruleset page appears.
IMPORTANT:This procedure assumes that your PCE is configured to display scopes in rulesets or the PCE contains scoped rulesets. See Basic versus Scoped Rulesets for information.
The page displays a proposed ruleset and relevant intra-scope and extra-scope rules for the ruleset. The PCE chooses the proposed ruleset based on the scope of the traffic flows you selected.
For example, you have selected two traffic flows that have the same set of labels so that they fall within the same scope. When you have a ruleset that already has that scope, the PCE defaults to that ruleset. Therefore, the PCE displays a list of options that match that scope. Alternatively, you select a third traffic flow that has different labels from the first two traffic flows, the PCE will display the global rulesets as an option to add the rules to.
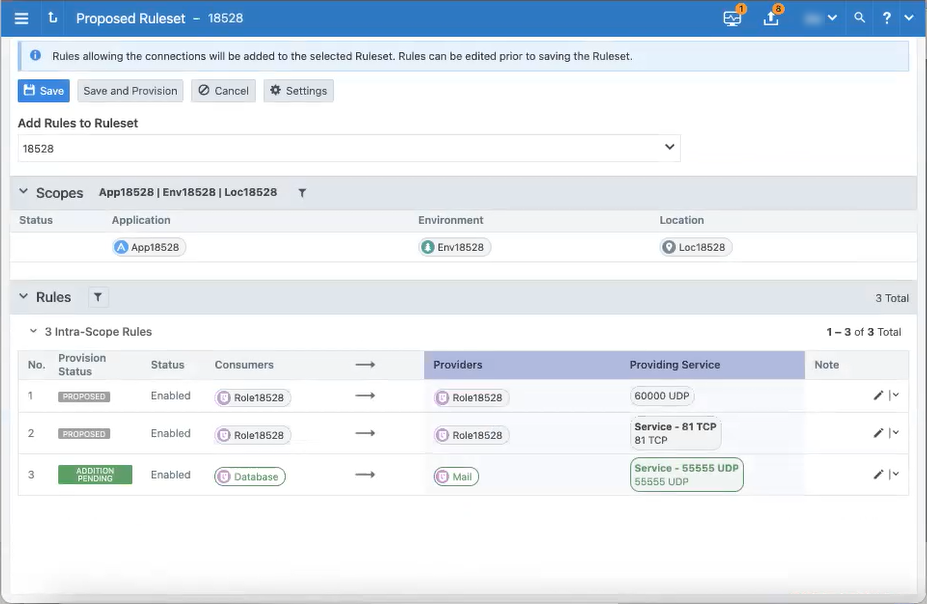
The following screenshot shows you selected two traffic flows that have the same set of labels, and therefore similar scopes. The PCE already contained a ruleset that had that scope and displayed it by default:
-
Either accept the default ruleset or select a different ruleset to add the rules to.
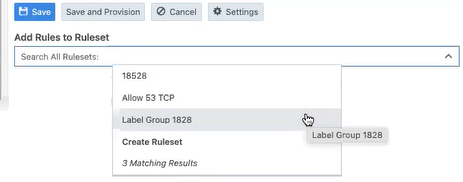 TIP:
TIP:Searching for a different ruleset is useful when you already have a ruleset containing a label group that matches the traffic. When you select a ruleset containing a label group, the PCE creates the rules based on that label group.
NOTE:The drop-down list of rulesets includes all the rulesets in the PCE. When you select a ruleset that is unrelated to the traffic flows selected in the Explorer list, the PCE displays an alert that the selected traffic flows are not covered by rules because they aren’t within the scope of the ruleset. The selected traffic flows do not match the selected scope and you cannot write rules based on these selections.
TIP:You can create a new ruleset by selecting Create Ruleset in the drop-down list. The Add Scopes option is available in Create Ruleset dialog box when a matching scope is available in the PCE. When this option is unavailable, you’ve chosen disparate traffic flows and the ruleset is created as a global ruleset. After clicking Continue, the new ruleset appears in the Proposed Ruleset page. You can further edit the labels for that new ruleset and then save it.
Based on the specified ruleset scope, the Proposed Ruleset page displays the existing related intra-scope or extra-scope rules in that scope.
-
As needed, edit the rules within the scope and save your changes by clicking the Save icons at the end of the rows.
NOTE:When you edit rules and if any overlap exists between rules due to your changes, the PCE will optimize the rules so that duplicates are eliminated.
IMPORTANT:If you toggle between rulesets before saving the proposed ruleset and you’ve edited the rules within that scope, the PCE will save your changes so long as the other ruleset selected has the same scope as the first one; otherwise, you will lose your changes.
-
To control whether the PCE creates the rules by using port and protocol versus a service object, click the Settings button.
In the Settings dialog box, you can choose to use the port/protocol, use a service, or create a new service if the service doesn’t already exist. By default, the PCE creates the rules by using the port/protocol.
-
One you’re satisfied with the ruleset selected and the rules within the ruleset, click Save or Save and Provision, depending on whether you want to immediately provision to ruleset.
See Provisioning in Security Policy Guide for information.