Ransomware Protection for Servers Dashboard
The Ransomware Protection dashboard provides broad visual information about ransomware protection readiness, risk exposure, and protection coverage.
One of the following global user roles are required to use the Ransomware Protection Dashboard:
-
Global Org Owner
-
Global Administrator
-
Global Viewer
About the Dashboard
To access the Ransomware Protection Dashboard, click Dashboard-> Ransomware Protection in the left navigation.
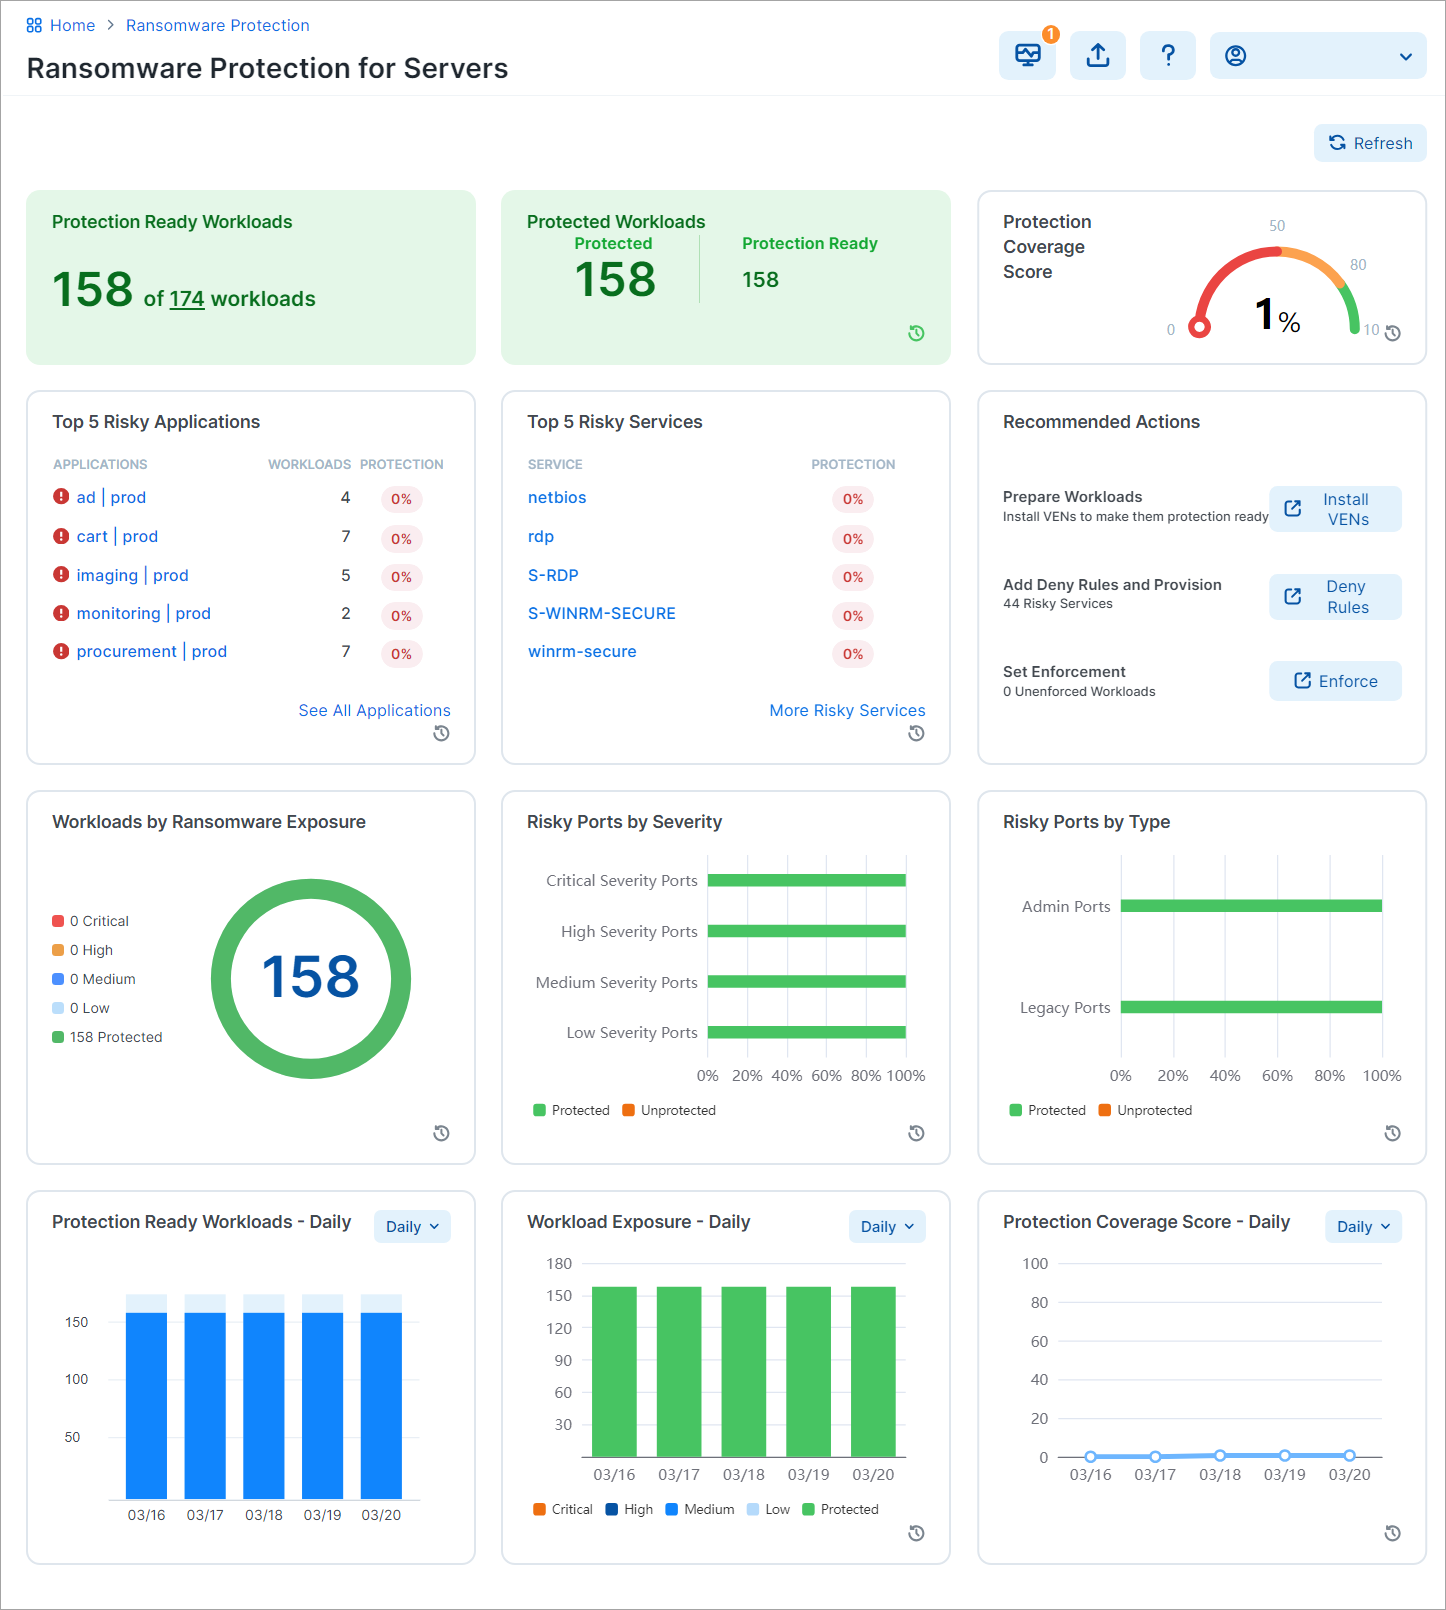
Dashboard Layout
The Dashboard includes multiple columns and widgets.
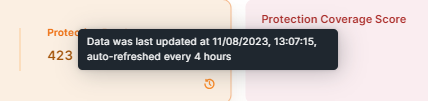
Refreshing the widget information
-
The widgets that include small clock icons are auto-refreshed every four hours. To learn about the auto-refresh schedule. click on the clock icon.
-
The widgets with no clock icons are refreshed when users click Refresh.

Widget color changes
Widgets change colors to show the percentage of the achieved coverage:
-
Red: indicates coverage between 0 and 50%
-
Yellow: indicates coverage between 50% and 80%
-
Green: indicates coverage between 80% and 100%
Getting more information from the Dashboard
-
Click Info (?) to learn about the Dashboard functions.
Widget Types
The Ransomware Protection Dashboard presents several types of widgets.
Protection Readiness Widgets
These widgets show workload protection readiness.
Protection Ready Workloads
A workload is protection-ready when there is a VEN installed on it and it is configurable to enforce Illumio security policies.
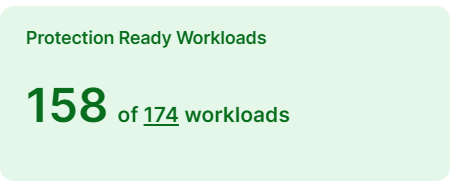
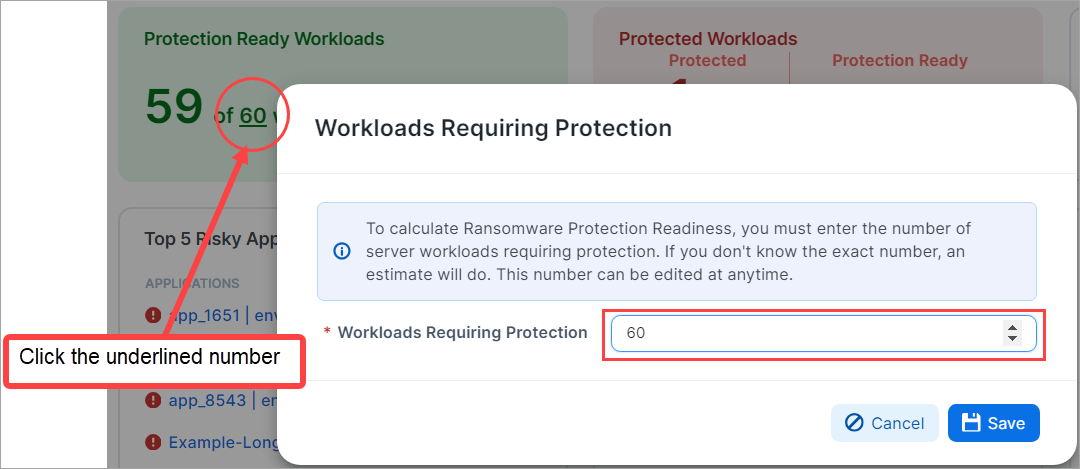
You can change the number of workloads requiring protection by clicking the underlined number on the widget and entering a new target number of workloads. This non-underlined number indicates the number of such workloads that are protection-ready.
Protection Ready Workloads over time
This widget provides a chart showing the number of Protection Ready workloads over a selected period of time.
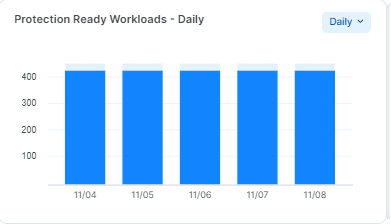
In each of the selected views, the number of Protection-Ready Workloads is represented as a percentage of the available target workloads (100%).
You can view protection readiness over time: Daily, Weekly, Monthly, and Quarterly.
Workload Protection Exposure Widgets
These widget display information about the workloads protection exposure.
Protected Workloads
A workload is protected when it has policies on all the ransomware-risky services / ports and the policies are enforced.
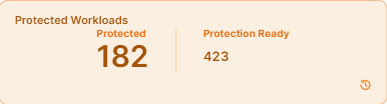
To be counted as a protected workload, the workload must be in Selective Enforcement or Full Enforcement mode.
In this example, out of 423 that are protection-ready, 182 workloads are protected. Because the percentage of protected workloads is 43%, the widget color is light red.
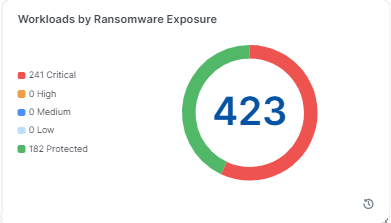
Workloads by Ransomware Exposure
This widget shows the number of workloads according to their ransomware exposure across the organization (Critical, High, Medium, Low, and Protected).
A workload is assessed according to its exposure to the services commonly exploited by ransomware.
For more details, see Services in the Security Policy guide.
A workload is protected from the service in these two cases:
-
The service is blocked by enforcement boundary in Selective Enforcement, or
-
The workload is in Full Enforcement, regardless of whether there is or is not a rule for that service.
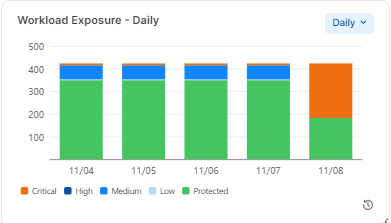
Workloads Exposure over time
The Workload Exposure widget shows, over the selected time period, the percentage of existing workloads that are or are not protected from the ransomware. Unprotected workloads are further grouped in their exposure categories as Critical, High, Medium, and Low.
Protection Coverage Widgets
Protection Coverage Score
The Protection Coverage Score is a metric used to measure the effectiveness of security policies in protecting workloads. It indicates the percentage of the entire possible attack surfaces that are actively protected by security policies. For example, a policy that allows all workloads as Source will have a lower coverage score compared to a policy that only allows a small number of Source workloads.
Protection coverage score takes all the protection-ready workloads into consideration across the organization.
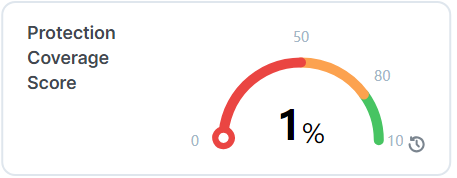
The color of the widget changes from red to yellow and then to green as the protection coverage score increases.
Protection Coverage Score over Time
This widget displays the percent of the ransomware protection coverage over a time period: Daily, Weekly, Monthly, and Quarterly. In each case, it displays the last data point of the period.
To help illustrate the protection coverage trends, five percentage data points are used: 20%, 40%, 60%, 80%, and 100%.
When you mouseover the widget, the pop-up shows ransomware protection during the target period.
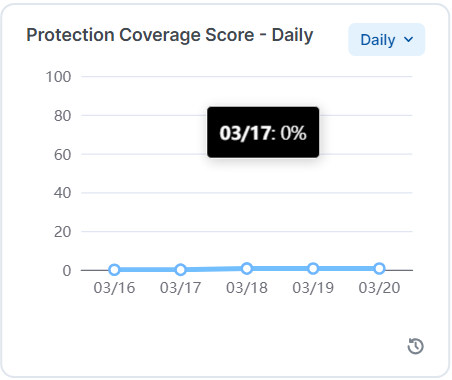
Table for 10 total address spaces:
| Enforcement Mode | Policy | blocked_peer_set_count | Coverage % |
|---|---|---|---|
| Selective Enforcement | No deny or allow | 0 | 0% |
| allow (no deny) | 0 | 0% | |
| Deny | 10 | 100% | |
| Deny and allow | 5 | 50% | |
| Full Enforcement | No allow rules | 10 | 100% |
| Allow | 5 | 50% |
Weight assigned for protection coverage score
| Protection | Weight assigned |
|---|---|
| Critical | 40 |
| High | 30 |
| Medium | 20 |
| Low | 10 |
Coverage score example
Protection coverage score calculation for four ports
| Ports | Policy | Idle | Visibility | Selective Enforcement | Full Enforcement | |||||
|---|---|---|---|---|---|---|---|---|---|---|
| SMB | S-SMB | TCP | 445 | Critical | 40 | No rules | Unprotected | Unprotected | 0 | 100% |
| VNC | S-VNC | TCP | 5900 | High | 30 | Deny rules | Unprotected | Unprotected | 100% | 100% |
| POP3 | S-POPV3 | TCP | 110 | Low | 10 | Allowed rules | Unprotected | Unprotected | 0 | 50% |
| FTP Data | S-FTP-DATA | TCP | 20 | Medium | 20 | Deny rules and allow rules | Unprotected | Unprotected | 50% | 50% |
| Protection Coverage Score | 0% | 0% | 40% | 85% | ||||||
According to the table above, here is how the protection coverage was calculated:
-
Selective Enforcement = ( 40 * 0 + 30 * 100% + 10 * 0 + 20 * 50%) / (40+30+10+20) = 40%
-
Full Enforcement = ( 40 * 100% + 30 * 100% + 10 * 50% + 20 * 50%) / (40+30+10+20) = 85%
Top 5 Risky Applications and Services
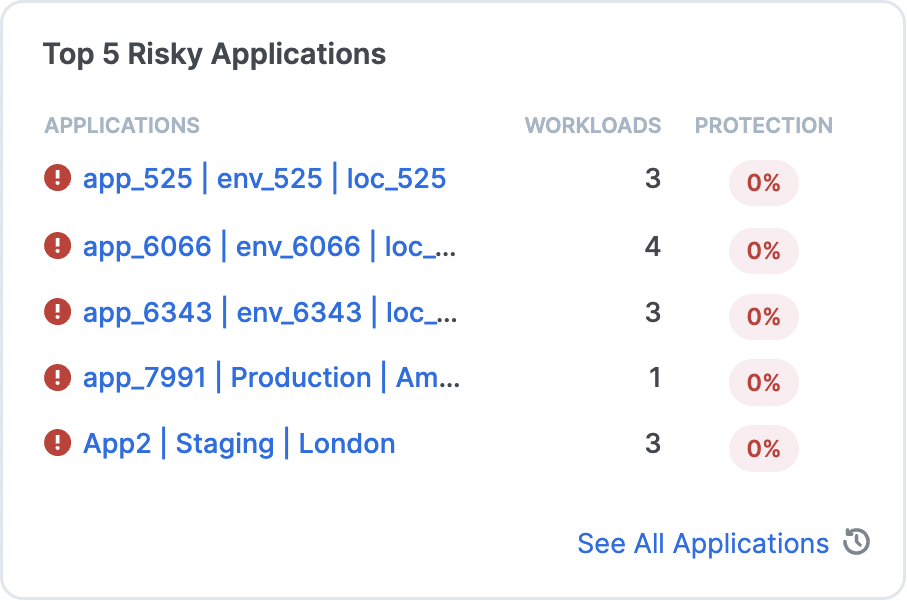
Risky Applications
This widget displays the top 5 riskiest applications in your environment. Application risk is based on the Protection Coverage Score that appears in the App Group List. For an app-level risk assessment and remediation recommendations, click any application in the list to redirect to its details page.
For an app-level risk assessment and remediation recommendations, click any application in the list to redirect to its details page.
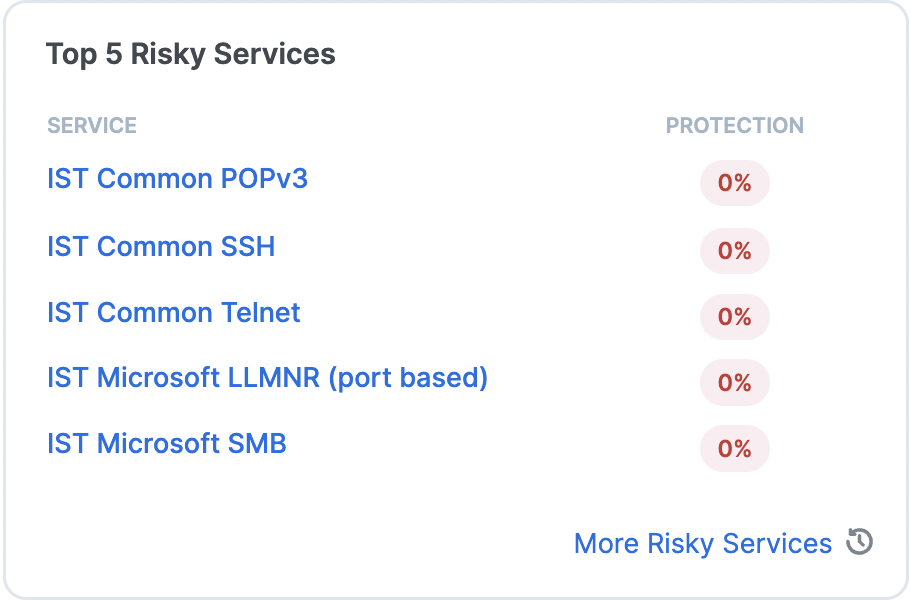
Risky Services
The PCE automatically assigns default ransomware protection settings on certain services deemed to be at risk of ransomware penetration and lateral movement. These services and their default risk assessment are listed in the Ransomware-risky services table below. Based on this default risk assignment, the top 5 riskiest services in your environment are displayed in a dedicated widget on the Ransomware Dashboard.
Click any service in the list to redirect to its details page. From there you can edit or remove the service, or navigate up one level to add new services.
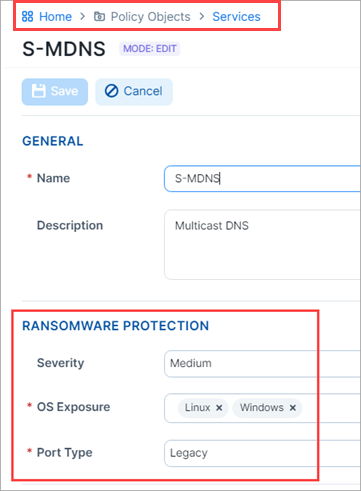
To address the unique conditions in your environment, you can change the default ransomware risk assessment on a per-service basis by gong to Policy Objects > Services and changing the Severity as shown in the following image.
Ransomware-risky services table
The list of services at risk of ransomware penetration and lateral movement is provided in this table to help you assess ransomware exposure on your Enterprise Services. All new organizations created after the release 23.2 have services created and tagged with the metadata as system default. Organizations created before the release 23.2 with services that have exact match of protocol and port numbers will be tagged with the ransomware risk metadata.
| Service | Service Name | Protocol | Port Number | Severity | Category | OS |
|---|---|---|---|---|---|---|
| HTTP | S-HTTP | TCP | 80 | Medium | Legacy | Linux, Windows |
| LLMNR | S-LLMNR | UDP | 5355 | Medium | Legacy | Linux, Windows |
| NFS | S-NFS | TCP/UDP | 2049 | Medium | Admin | Linux |
| RDP | S-RDP | TCP/UDP | 3389 | Critical | Admin | Windows |
| MSFT RPC | S-RPC | TCP | 135 | Critical | Admin | Linux, Windows |
| SMB | S-SMB | TCP/UDP | 445 | Critical | Admin | Linux, Windows |
| SSH | S-SSH | TCP/UDP | 22 | Medium | Admin | Linux |
| WinRM | S-WINRM | TCP | 5985 | Critical | Admin | Windows |
| WinRM Secure | S-WINRM-SECURE | TCP | 5986 | Critical | Admin | Windows |
| FTP Data | S-FTP-DATA | TCP | 20 | Medium | Legacy | Linux, Windows |
| FTP Control | S-FTP-CONTROL | TCP | 21 | Medium | Legacy | Linux, Windows |
| METASPLOIT | S-METASPLOIT | TCP/UDP | 4444 | Low | Legacy | Linux, Windows |
| Multicast DNS | S-MDNS | UDP | 5353 | Medium | Legacy | Windows |
| NetBIOS | S-NETBIOS |
UDP TCP |
137, 138 137, 139 |
High | Legacy | Windows |
| POP3 | S-POPV3 | TCP | 110 | Low | Legacy | Linux, Windows |
| PPTP | S-PPTP | TCP/UDP | 1723 | Low | Legacy | Linux, Windows |
| SSDP | S-SSDP | UDP | 1900 | Medium | Legacy | Windows |
| SunRPC | S-SUNRPC | TCP/UDP | 111 | Low | Legacy | Linux |
| TeamViewer | S-TEAMVIEWER | TCP/UDP | 5938 | High | Admin | Linux, Windows |
| Telnet | S-TELNET | TCP/UDP | 23 | Medium | Admin | Linux, Windows |
| VNC | S-VNC | TCP/UDP | 5900 | High | Admin | Linux, Windows |
| WSD | S-WSD | TCP/UDP | 3702 | Medium | Legacy | Windows |
Risky Ports Widgets
These widgets illustrate risky ports in your environment.
Risky Ports by Severity
This widget shows the percentage of ransomware-risky ports in your environment according to their level of severity (Critical, High, Medium, and Low). Each category of risky ports has a different total on each workload, and therefore, across the environment.
To help illustrate the protection coverage by severity, five percentage data points are used: 20%, 40%, 60%, 80%, and 100%.
Colored bars depict the percentage of protected (green) and unprotected (orange) ports.
![]()
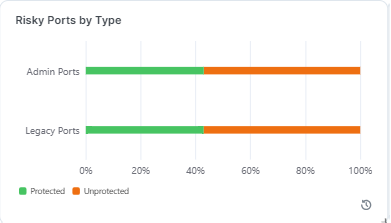
Risky Ports by Type
This widget shows the percentage of ransomware-risky ports in your environment by type, administrative or legacy.
To help illustrate the protection coverage by port type, five percentage data points are used: 20%, 40%, 60%, 80%, and 100%.
Colored bars depict the percentage of protected (green) and unprotected (orange) ports.
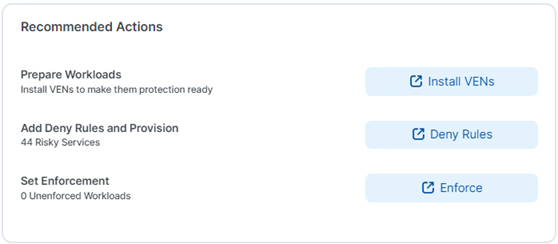
Recommended Actions Widget
This widget presents links for securing your workloads so that you can more easily address the risks revealed in the other widgets.
Workload Ransomware Protection for Servers Details
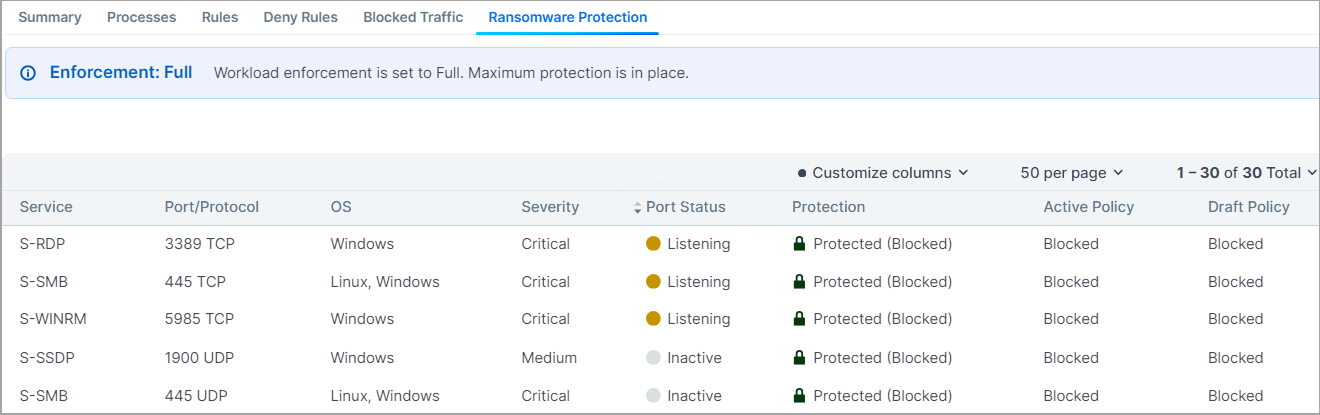
The Ransomware Protection tab provides detailed protection information for the workloads regarding each of the ransomware-risky services.
Information about the ransomware risk is then aggregated into the Ransomware Protection for Servers Dashboard for the system-side ransomware risk analysis.
The Severity and Port Type are designated per each ransomware-risky service.
For more details, see Services in the Security Policy guide.
Here is the explanation for the data provided in the Ransomware Protection table:
-
Severity: Severity of the ransomware risk, which can be Critical, High, Medium or Low.
-
Port Status: Port status can be Active or Inactive.
-
Listening: Listening means there is a running process on that port.
-
Inactive: Inactive means there is no process running on the port. The same information is also provided on the Processes tab.
-
-
Port Type: The port type can be Admin or Legacy.
-
Admin: Admin refers to the service and ports are used for common administrative tasks.
-
Legacy: Legacy means that ports are used for legacy protocols.
-
-
Protection: Protection types are:
-
Protected (Blocked). When port is blocked by deny rules in Selective Enforcement or blocked with no allow rules in Full Enforcement. No ransomware can propagate through that port.
-
Unprotected The port is exposed to ransomware exploits.
-
-
Protected (Allowed by Policy). When there are allow rules intentionally policing the traffic. Only the trusted sources are allowed to access the port and hence the risk of lateral movement for ransomware is reduced. The workload has to be either in Selective Enforcement or Full Enforcement for the policy to be enforced.
-
The Port status does not affect the protection state.
-
Active Policy and Draft Policy: Indicates whether there is an Active or Draft policy to protect that particular port and the corresponding action.
API Support for the Ransomware Protection for Servers Dashboard
The Dashboard uses several APIs to aggregate various data from the system and helps you focus on the data you are interested in.
The two main APIs are: time_series and risk_summary. To learn about APIs used to power the Ransomware Protection Dashboard, see Ransomware Protection Dashboard APIs.