You can use the visualization tools to perform the following tasks.
Workflow for Using the Visualization Tools
The visualization tools enable you to build security policies for your workloads by following this workflow:
- Group discovery: When you pair workloads, the VEN introspects those Workloads and determines their open ports, running services, and traffic flows. See the VEN Installation and Upgrade Guide for information about installing (also called pairing Installation of the Illumio VEN software on a workload using a unique secure pairing key. A Workload is paired by executing a pairing script generated from a Pairing Profile.) VENs on workloads.
- Prepare group for rules: Prepare a group for rules by applying labels to each workload in the group so you can write policies for them.
- Rule writing: After you have prepared the group for rule writing, you can begin to write rules for the workloads in the group. This requires writing rules to allow communication between workloads across groups, between workloads in the same group, or between workloads and other entities outside the group (for example, the Internet or an IP List). The Map also proposes suitable rules for you to use or modify if you do not want to manually create rules from scratch. See Rule Writing in the Security Policy Guide for more information.
- Rule Testing: The Map allows you to test and evaluate your rules against existing traffic flows without enforcing the rules. You can test Rules to ensure that legitimate traffic flows required by an application are permitted and malicious traffic is blocked. Exporting traffic summaries or using blocked traffic lets you know which traffic connections would be dropped if the rules were enforced. .
- Policy Enforcement: When you are ready to implement the rules for a group, you can put the group into the enforced state. Leveraging the Illumio Core allowlist policy model The allowlist model means that you must specifically define what traffic is allowed to communicate with your managed workloads; otherwise, it is blocked by default. It follows a trust-centric model that denies everything and only permits what you explicitly allow—a better choice in today’s data centers. The list of what you do want to connect in your data center is much smaller than what you do not want to connect., any traffic flows that are not explicitly allowed by a rule are dropped. If a legitimate application flow is broken or an intrusion occurs, you can configure notifications to alert you.
About Unmanaged IP Addresses
From the Map, you can quickly create unmanaged workloads from IP addresses. A reverse DNS lookup is done on the IP addresses to obtain and display the server name for the unmanaged workload. The server names are only displayed in the PCE UI. When you export the file, it lists IP addresses.
The DNS names are not displayed on the Map for Illumio Core Cloud customers.
When you select an IP address in the Map that is not currently associated with another policy object, it automatically populates the IP address into an unmanaged workload with the following values:
- A default interface of eth0
- The hostname, which is the IP address by default
You can select IPv4 or IPv6 addresses displayed in the Map from the internet, IP lists, or traffic links. You can change the default interface and hostname if needed and you can add labels to the unmanaged workload.
Until new traffic for the unmanaged workload is observed, the traffic lines are not displayed for the unmanaged workload. The traffic lines in the Map are updated after new flows are reported by the PCE.
If you try to create an unmanaged workload from an IP address where an unmanaged workload already exists, an error message is displayed.
After you convert an unmanaged IP address to an unmanaged workload, you can use it in your policy; for example, you want to allow one of your hosts to communicate with a managed workload. A reverse DNS lookup is done on the IP addresses listed under the Destination column and you see the name of the server instead of the IP address.
Create an Unmanaged Workload from an IP Address
The Map includes groups for unmanaged IP addresses. First, the PCE maps IP addresses to an IP list; then, if the IP address is in the RFC set of IP addresses, those IP addresses appear in the private IP address group. Lastly, the Map contains a public IP address group that encompasses all the rest of the IP addresses that are part of the Internet. You can create unmanaged workloads for each type of IP address.
-
In the Map, click one of the following groups: IP List, Private Addresses, or Public Addresses.
The right-side panel for the object opens. If you click an IP List group, the Summary tab displays the IP addresses in each IP list. Similarly, if you click a Private or Public IP Address group, the Summary tab displays the list of IP addresses.
-
If you're viewing an IP list in the panel, click the name of an IP list to expand it in the panel. The panel displays any unmanaged lP addresses that are communicating with your managed workloads. (For public and private IP addresses, you can skip this step.)
NOTE:If you have a reverse DNS lookup, the server name is used instead of the IP address.
-
Select the checkbox adjacent to the IP address for which you want to create an unmanaged workload.
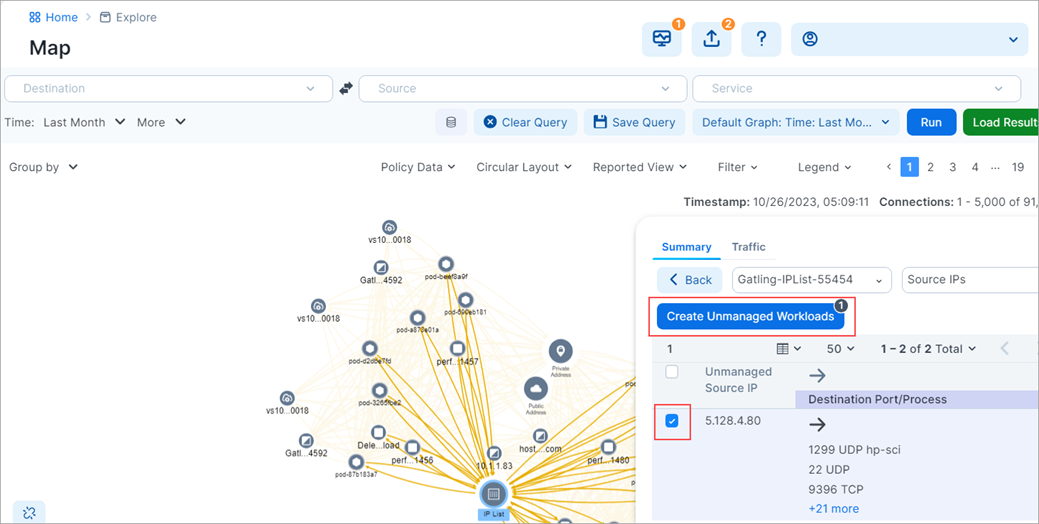
- Click Create Unmanaged Workloads.
- In the Assign Labels dialog box, click the drop-down list and select the labels you want to assign to the unmanaged workload.
- Click Confirm.
-
[Optional] Recalculate your map with the newly created unmanaged workload by clicking Recalculate in the confirmation dialog box.
-
In the left navigation, click Workloads.
- In the Workloads list, locate the new unmanaged workload you created. Identify the unmanaged workload by its name, which is its IP address.
-
Click IP address in the Workload list.
-
Click Edit and enter the workload information. For information about the fields for unmanaged workloads, see Add an Unmanaged Workload.
- Click Save.
No enforcement information is available for the new unmanaged workload because it doesn't yet have a VEN installed on it.
Add Rules for Traffic Using the Traffic Table
You can use the Map to add rules for traffic flows by selecting traffic flows and then allowing the selected connections.
In the Traffic table, you can only write rules for one page of traffic flows at a time. You must click through each page. (This limitation matches the way other tasks are performed in the Traffic table.)
To add rules for traffic flows:
- In the left navigation, click Traffic.
- Select Connections in the Connections filter.
-
From the Group by drop-down, select Common Set of Labels and then click Apply.
- From the Draft View drop-down, select a Draft View.
-
Using the checkboxes, select traffic flows that you want to write rules for.
The Allow Selected Connections button becomes available and includes the number of allowable connections for which the PCE can write rules.
-
Click Allow Selected Connections.
NOTE:Under certain conditions the button won’t be enabled; for example, when you’ve only selected traffic flows that are already allowed. When this occurs, either select other traffic flows or click Edit Labels to modify the traffic flows.
The page refreshes and displays proposed rulesets or rules depending on whether you have enabled basic or advanced modes for rule writing. See Basic and Advanced Modes for Rules in the Security Policy Guide for a distinction between these modes.
When you are using the basic mode for rule writing, the page contains only a list of proposed rules, and you aren't able to add scoped rulesets. You can only select global rulesets.
When advanced mode for rule writing is enabled (so that you can create scoped rules), the page contains tabs for relevant intra-scope and extra-scope rules for the ruleset. The PCE chooses the proposed ruleset based on the scope of the traffic flows you selected.

For example, you have selected two traffic flows that have the same set of labels so that they fall within the same scope. When you have a ruleset that already has that scope, the PCE defaults to that ruleset. Therefore, the PCE displays a list of options that match that scope. Alternatively, you select a third traffic flow that has different labels from the first two traffic flows, the PCE will display the global rulesets as an option to add the rules to.
-
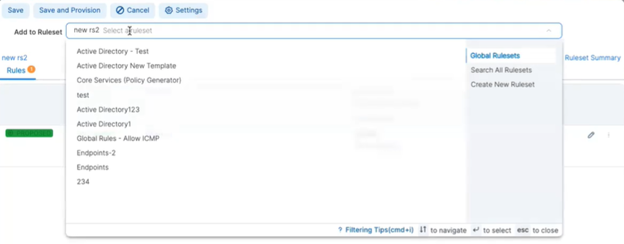
Either accept the default ruleset or select a different ruleset to add the rules to.

When in advanced rule writing mode, the Add to Ruleset drop-down menu contains these categories: rulesets appropriate for the scope, global rulesets, and the ability to search all rulesets, and create a new ruleset.
When you elect to create a new ruleset, the Add Ruleset dialog box appears. Select the Add Scopes checkbox to see all the scopes that are common to the selected traffic flows you are adding rules for.
-
As needed, edit the scopes for your ruleset and then click Save icon:

After clicking the Edit icon, the scope field become editable:

If you remove all the scopes from the ruleset, the labels for the scope appear in the rules.
-
[Optional] To control how the PCE uses services in the rules, click Settings.
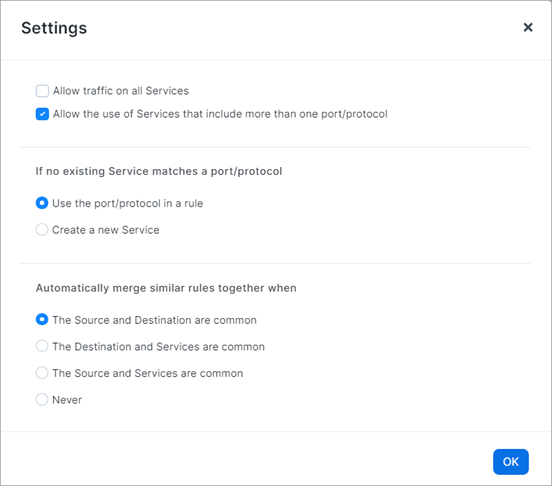
You can choose to allow all services or services that include more than one port/protocol.
When you select Allow the use of Services that include more than one port/protocol, the PCE doesn't require an exact match on the service. For example, you want to use service TCP 3306 but the PCE contains TCP/UDP 3306. Selecting this option enables the rule to use TCP/UDP 3306 as a matching service. When the PCE doesn't have a matching service you can choose to use the port/protocol in the rule or create a new service. By default, the PCE creates the rules by using the port/protocol.
-
As needed, edit the proposed rules and save your changes by clicking the Save icons at the end of the rows.
NOTE:When you edit rules and if any overlap exists between rules due to your changes, the PCE will optimize the rules so that duplicates are eliminated. For each duplicate rule that isn't provisioned, the PCE displays a label in left column “Proposed Delete” and will delete that rule.
-
One you’re satisfied with the ruleset selected and the rules within the ruleset, click Save or Save and Provision, depending on whether you want to immediately provision the ruleset.
See Provisioning in Security Policy Guide for information.
After saving your ruleset and rules, the PCE UI reloads your data so that the Traffic table and Map view reflect the changes.

Write a Ringfencing Rule
Using the Map view, you can quickly create a ringfencing rule by adding that rule to a new ruleset within the scope of the selected group.
-
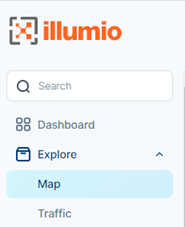
In the left navigation, click Map.
-
Verify the criteria by which the group was established.
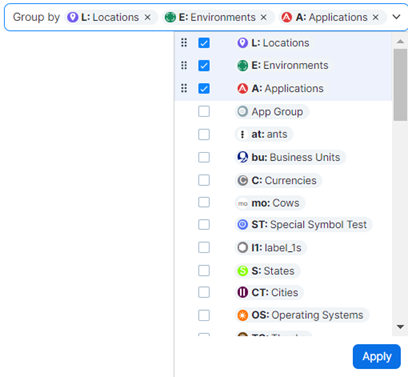
In the Group by filter, select the grouping criteria. -
Keep the current selection (Locations, Environments, Applications), or add or remove the grouping criteria.
- Once you have the desired selection, click Apply.
The group is now established according to your needs. -
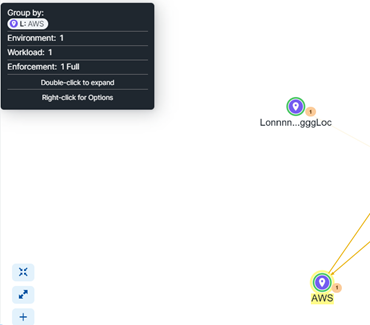
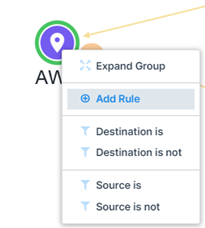
Now put the cursor over the group that you want to change (here it is AWS).
-
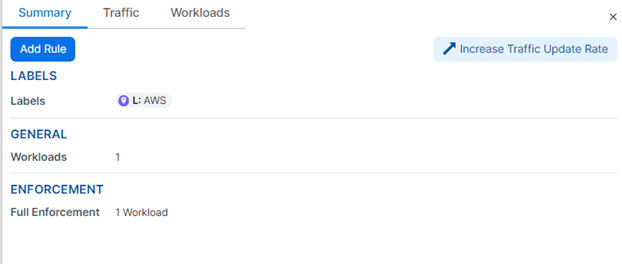
You can also click on the group to see its stats that show in the right panel.
-
Now click on the group where you are adding the rule and then on Add Rule.
-
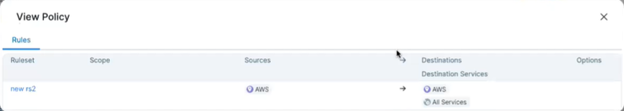
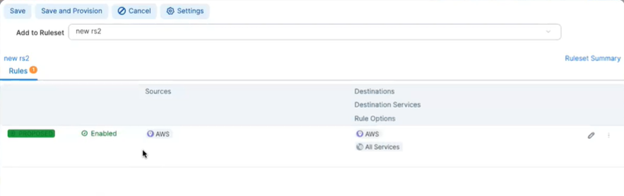
Choose the ruleset to which you are adding the new rule. For example, the ruleset named new rs2.
-
Select Rule Options.
For example, you can select All Services. -
Add a rule that is All Services to All Services.
-
After you have added the rule, click View Rule to view it.
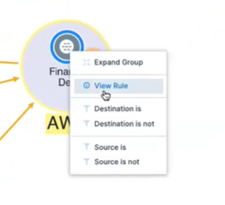
The pop-up dialog on the left shows the selected group’s stats.
Everything inside that Rule communicates with each other.
Monitor Traffic Database Size and Receive Alerts
You can monitor your database traffic usage and be alerted when you are close to capacity.
The storage information is based on your customer organization limit and not the overall capacity of the PCE for your environment.
To monitor traffic database size:
-
In the PCE UI left navigation, choose Explore > Traffic.
The Traffic page appears.
-
From the top status bar, hover over the database icon:

A pop-up window appears, which displays the how many more days of data you can store your traffic data in the Illumio Core cloud. You receive an alert when your disk space is within 15% of your available space.