Illumio Xpress visualization tools provide a unique new way to reveal the traffic flows in your network and to help you configure policies to secure your applications.
This page provides an overview of Xpress visualization tools. For more detailed descriptions of particular features, see the following:
How to read the Illumio Xpress Map
Legend
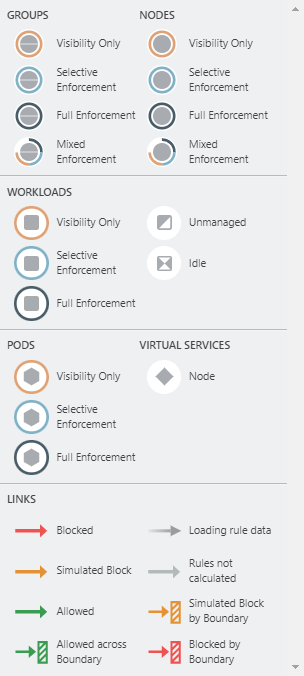
Pay attention to the following:
- Workloads and groups inside full dark lines depict the Full Enforcement mode
- Workloads and groups inside light blue lines depict the Selective Enforcement mode
- Workloads and groups inside light orange lines depict theVisibility only mode
- The ring around a group denotes the proportions of different enforcement states
Traffic links are presented with arrows in different colors:
- Green: Traffic is allowed
- Yellow: Traffic is simulated blocked
- Red: Traffic is blocked
- Grey: Rules are not calculated
- Gradient arrows: The light color is next to the source and dark next to the destination. Gradient arrows are used while the rule data is still loading from the traffic.
Illumio Xpress Visualization Views
This section describes the features under the Explore category of left navigation.
Map View
The Illumio Xpress Map view lets you group by labels, locations, etc. It also lets you choose layouts and split the view by selecting items on the map.
Configurable Grouping
Using the Group by menu, you can add different levels of grouping, such as grouping by types of labels and their order. You might want grouping by OS and then by environment. If you do not specify a particular grouping, Illumio will group workflows by the default, which is by workloads with the same set of labels. You can change your organization's default grouping using the same dropdown menu. This dropdown menu is also available in Mesh View.
Traffic View
The Illumio Xpress Traffic view lets you view the same items in tabular view. It also gives you the options to resolve fully qualified domain names (FQDNs) and to export the table.
Mesh View
The Illumio Xpress Mesh view lets you view the same items in a mesh view. Like the Map view, it lets you configure grouping. It also gives you the option to use a brush slider to select ranges of source and destination items.
How Illumio Xpress Visualization Tools Work with Fully Qualified Domain Names
Illumio Xpress visualization tools map the outbound connections from workloads to unknown IP addresses to FQDNs or DNS-based names. For example, it could display that the outbound connections from a workload are going to maps.google.com instead of 100s of different IP addresses. The FQDNs used are reported by the VEN to the PCE in the flow summaries. The VEN learns about the FQDNs by snooping the DNS responses on the workloads, which is the FQDN for the IP address as seen by the workload.
The map visualizes the workloads that form logical groups (based on labels attached to workloads) and provides an understanding of the traffic flows between workloads.